municipio de ciudad valles - secretaria de desarrollo economico slp
municipio de ciudad valles - secretaria de desarrollo economico slp
municipio de ciudad valles - secretaria de desarrollo economico slp

Create successful ePaper yourself
Turn your PDF publications into a flip-book with our unique Google optimized e-Paper software.
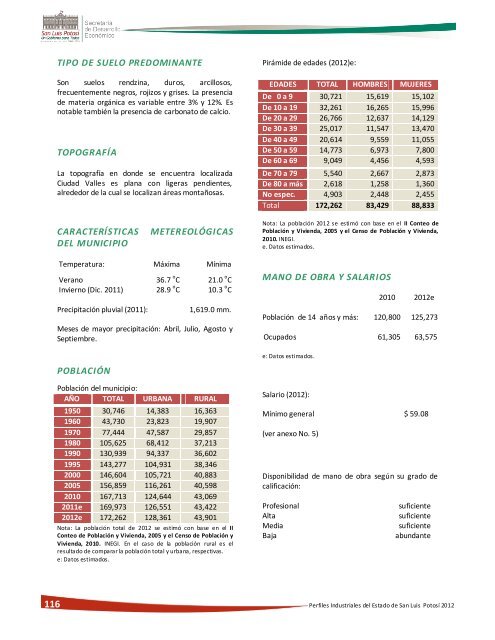
116<br />
TIPO DE SUELO PREDOMINANTE<br />
Son suelos rendzina, duros, arcillosos,<br />
frecuentemente negros, rojizos y grises. La presencia<br />
<strong>de</strong> materia orgánica es variable entre 3% y 12%. Es<br />
notable también la presencia <strong>de</strong> carbonato <strong>de</strong> calcio.<br />
TOPOGRAFÍA<br />
La topografía en don<strong>de</strong> se encuentra localizada<br />
Ciudad Valles es plana con ligeras pendientes,<br />
alre<strong>de</strong>dor <strong>de</strong> la cual se localizan áreas montañosas.<br />
CARACTERÍSTICAS METEREOLÓGICAS<br />
DEL MUNICIPIO<br />
Temperatura: Máxima Mínima<br />
Verano 36.7 o C 21.0 o C<br />
Invierno (Dic. 2011) 28.9 o C 10.3 o C<br />
Precipitación pluvial (2011): 1,619.0 mm.<br />
Meses <strong>de</strong> mayor precipitación: Abril, Julio, Agosto y<br />
Septiembre.<br />
POBLACIÓN<br />
Población <strong>de</strong>l <strong>municipio</strong>:<br />
AÑO TOTAL URBANA RURAL<br />
1950 30,746 14,383 16,363<br />
1960 43,730 23,823 19,907<br />
1970 77,444 47,587 29,857<br />
1980 105,625 68,412 37,213<br />
1990 130,939 94,337 36,602<br />
1995 143,277 104,931 38,346<br />
2000 146,604 105,721 40,883<br />
2005 156,859 116,261 40,598<br />
2010 167,713 124,644 43,069<br />
2011e 169,973 126,551 43,422<br />
2012e 172,262 128,361 43,901<br />
Nota: La población total <strong>de</strong> 2012 se estimó con base en el II<br />
Conteo <strong>de</strong> Población y Vivienda, 2005 y el Censo <strong>de</strong> Población y<br />
Vivienda, 2010. INEGI. En el caso <strong>de</strong> la población rural es el<br />
resultado <strong>de</strong> comparar la población total y urbana, respectivas.<br />
e: Datos estimados.<br />
Pirámi<strong>de</strong> <strong>de</strong> eda<strong>de</strong>s (2012)e:<br />
EDADES TOTAL HOMBRES MUJERES<br />
De 0 a 9 30,721 15,619 15,102<br />
De 10 a 19 32,261 16,265 15,996<br />
De 20 a 29 26,766 12,637 14,129<br />
De 30 a 39 25,017 11,547 13,470<br />
De 40 a 49 20,614 9,559 11,055<br />
De 50 a 59 14,773 6,973 7,800<br />
De 60 a 69 9,049 4,456 4,593<br />
De 70 a 79 5,540 2,667 2,873<br />
De 80 a más 2,618 1,258 1,360<br />
No espec. 4,903 2,448 2,455<br />
Total 172,262 83,429 88,833<br />
Nota: La población 2012 se estimó con base en el II Conteo <strong>de</strong><br />
Población y Vivienda, 2005 y el Censo <strong>de</strong> Población y Vivienda,<br />
2010. INEGI.<br />
e. Datos estimados.<br />
MANO DE OBRA Y SALARIOS<br />
2010 2012e<br />
Población <strong>de</strong> 14 años y más: 120,800 125,273<br />
Ocupados 61,305 63,575<br />
e: Datos estimados.<br />
Salario (2012):<br />
Mínimo general $ 59.08<br />
(ver anexo No. 5)<br />
Disponibilidad <strong>de</strong> mano <strong>de</strong> obra según su grado <strong>de</strong><br />
calificación:<br />
Profesional suficiente<br />
Alta suficiente<br />
Media suficiente<br />
Baja abundante<br />
Perfiles Industriales <strong>de</strong>l Estado <strong>de</strong> San Luis Potosí 2012