gestión minorista de las marcas de distribuidor - RevistasICE
gestión minorista de las marcas de distribuidor - RevistasICE
gestión minorista de las marcas de distribuidor - RevistasICE

You also want an ePaper? Increase the reach of your titles
YUMPU automatically turns print PDFs into web optimized ePapers that Google loves.
MÓNICA GÓMEZ SUÁREZ Y NATALIA RUBIO BENITO<br />
comparativamente los niveles <strong>de</strong> calidad y precio <strong>de</strong><br />
venta al público <strong>de</strong> <strong>las</strong> <strong>marcas</strong> <strong>de</strong> <strong>distribuidor</strong> y <strong>de</strong> fabricante<br />
que compiten en <strong>las</strong> categorías <strong>de</strong> productos <strong>de</strong><br />
gran consumo con <strong>las</strong> que trabaja la fuente utilizada.<br />
Debe señalarse que la muestra seleccionada por la<br />
fuente contiene <strong>marcas</strong> <strong>de</strong> fabricante <strong>de</strong> prestigio (nacionales)<br />
y <strong>marcas</strong> <strong>de</strong> fabricante poco reconocidas (regionales).<br />
Estas últimas <strong>marcas</strong> suelen pertenecer a fabricantes<br />
<strong>de</strong> pequeño tamaño y bajo grado <strong>de</strong> diferenciación,<br />
y presentar niveles <strong>de</strong> precio y calidad objetiva<br />
más bajos que <strong>las</strong> <strong>marcas</strong> nacionales, pertenecientes a<br />
fabricantes <strong>de</strong> mayor tamaño y con niveles <strong>de</strong> diferenciación<br />
superiores. Por este motivo, la calidad y el precio<br />
<strong>de</strong> <strong>las</strong> <strong>marcas</strong> <strong>de</strong> fabricante se analiza <strong>de</strong> forma<br />
agregada para el conjunto <strong>de</strong> <strong>marcas</strong> y <strong>de</strong> forma <strong>de</strong>sagregada<br />
para los segmentos <strong>de</strong> <strong>marcas</strong> <strong>de</strong> fabricantes<br />
nacionales, por una parte y regionales, por otra.<br />
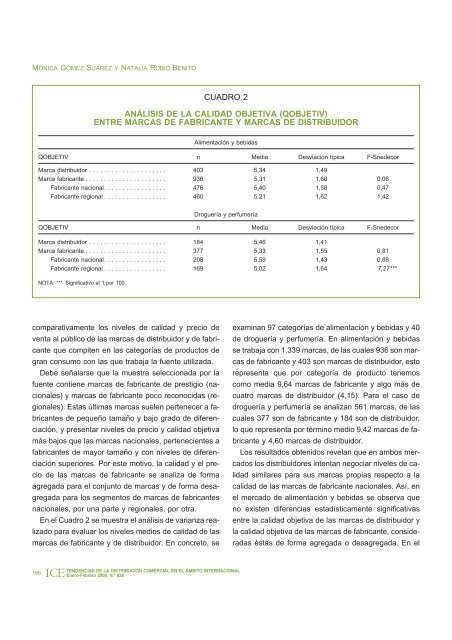
En el Cuadro 2 se muestra el análisis <strong>de</strong> varianza realizado<br />
para evaluar los niveles medios <strong>de</strong> calidad <strong>de</strong> <strong>las</strong><br />
<strong>marcas</strong> <strong>de</strong> fabricante y <strong>de</strong> <strong>distribuidor</strong>. En concreto, se<br />
166<br />
ICE<br />
CUADRO 2<br />
ANÁLISIS DE LA CALIDAD OBJETIVA (QOBJETIV)<br />
ENTRE MARCAS DE FABRICANTE Y MARCAS DE DISTRIBUIDOR<br />
Alimentación y bebidas<br />
QOBJETIV n Media Desviación típica F-Sne<strong>de</strong>cor<br />
Marca <strong>distribuidor</strong> ..................... 403 5,34 1,49<br />
Marca fabricante ...................... 936 5,31 1,60 0,06<br />
Fabricante nacional. ................ 476 5,40 1,58 0,47<br />
Fabricante regional ................. 460 5,21 1,62 1,42<br />
Droguería y perfumería<br />
QOBJETIV n Media Desviación típica F-Sne<strong>de</strong>cor<br />
Marca <strong>distribuidor</strong> ..................... 184 5,46 1,41<br />
Marca fabricante ...................... 377 5,33 1,55 0,81<br />
Fabricante nacional. ................ 208 5,59 1,43 0,88<br />
Fabricante regional ................. 169 5,02 1,64 7,27***<br />
NOTA: *** Significativo al 1 por 100.<br />
TENDENCIAS DE LA DISTRIBUCIÓN COMERCIAL EN EL ÁMBITO INTERNACIONAL<br />
Enero-Febrero 2006. N.º 828<br />
examinan 97 categorías <strong>de</strong> alimentación y bebidas y 40<br />
<strong>de</strong> droguería y perfumería. En alimentación y bebidas<br />
se trabaja con 1.339 <strong>marcas</strong>, <strong>de</strong> <strong>las</strong> cuales 936 son <strong>marcas</strong><br />
<strong>de</strong> fabricante y 403 son <strong>marcas</strong> <strong>de</strong> <strong>distribuidor</strong>, esto<br />
representa que por categoría <strong>de</strong> producto tenemos<br />
como media 9,64 <strong>marcas</strong> <strong>de</strong> fabricante y algo más <strong>de</strong><br />
cuatro <strong>marcas</strong> <strong>de</strong> <strong>distribuidor</strong> (4,15). Para el caso <strong>de</strong><br />
droguería y perfumería se analizan 561 <strong>marcas</strong>, <strong>de</strong> <strong>las</strong><br />
cuales 377 son <strong>de</strong> fabricante y 184 son <strong>de</strong> <strong>distribuidor</strong>,<br />
lo que representa por término medio 9,42 <strong>marcas</strong> <strong>de</strong> fabricante<br />
y 4,60 <strong>marcas</strong> <strong>de</strong> <strong>distribuidor</strong>.<br />
Los resultados obtenidos revelan que en ambos mercados<br />
los <strong>distribuidor</strong>es intentan negociar niveles <strong>de</strong> calidad<br />
similares para sus <strong>marcas</strong> propias respecto a la<br />
calidad <strong>de</strong> <strong>las</strong> <strong>marcas</strong> <strong>de</strong> fabricante nacionales. Así, en<br />
el mercado <strong>de</strong> alimentación y bebidas se observa que<br />
no existen diferencias estadísticamente significativas<br />
entre la calidad objetiva <strong>de</strong> <strong>las</strong> <strong>marcas</strong> <strong>de</strong> <strong>distribuidor</strong> y<br />
la calidad objetiva <strong>de</strong> <strong>las</strong> <strong>marcas</strong> <strong>de</strong> fabricante, consi<strong>de</strong>radas<br />
éstas <strong>de</strong> forma agregada o <strong>de</strong>sagregada. En el