Prevalencia y Factores Asociados a la No Adherencia al ...
Prevalencia y Factores Asociados a la No Adherencia al ...
Prevalencia y Factores Asociados a la No Adherencia al ...

You also want an ePaper? Increase the reach of your titles
YUMPU automatically turns print PDFs into web optimized ePapers that Google loves.
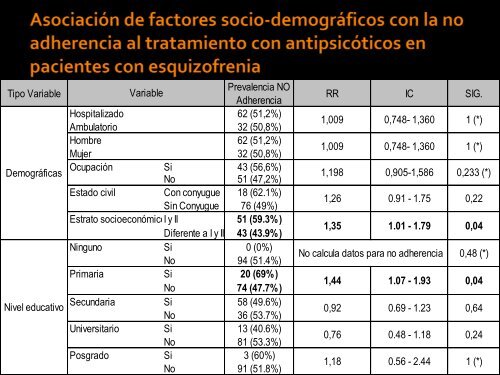
Tipo Variable<br />
Demográficas<br />
Nivel educativo<br />
Variable<br />
<strong>Prev<strong>al</strong>encia</strong> NO<br />
<strong>Adherencia</strong><br />
Hospit<strong>al</strong>izado 62 (51,2%)<br />
Ambu<strong>la</strong>torio 32 (50,8%)<br />
Hombre 62 (51,2%)<br />
Mujer 32 (50,8%)<br />
Ocupación Si 43 (56,6%)<br />
<strong>No</strong> 51 (47,2%)<br />
Estado civil Con conyugue 18 (62.1%)<br />
Sin Conyugue 76 (49%)<br />
Estrato socioeconómicoI y II 51 (59.3%)<br />
Diferente a I y II 43 (43.9%)<br />
Ninguno Si 0 (0%)<br />
<strong>No</strong> 94 (51.4%)<br />
Primaria Si 20 (69%)<br />
<strong>No</strong> 74 (47.7%)<br />
Secundaria Si 58 (49.6%)<br />
<strong>No</strong> 36 (53.7%)<br />
Universitario Si 13 (40.6%)<br />
<strong>No</strong> 81 (53.3%)<br />
Posgrado Si 3 (60%)<br />
<strong>No</strong> 91 (51.8%)<br />
RR IC SIG.<br />
1,009 0,748- 1,360 1 (*)<br />
1,009 0,748- 1,360 1 (*)<br />
1,198 0,905-1,586 0,233 (*)<br />
1,26 0.91 - 1.75 0,22<br />
1,35 1.01 - 1.79 0,04<br />
<strong>No</strong> c<strong>al</strong>cu<strong>la</strong> datos para no adherencia 0,48 (*)<br />
1,44 1.07 - 1.93 0,04<br />
0,92 0.69 - 1.23 0,64<br />
0,76 0.48 - 1.18 0,24<br />
1,18 0.56 - 2.44 1 (*)