IATTC Fishery Status Report 8 - Comisión Interamericana del Atún ...
IATTC Fishery Status Report 8 - Comisión Interamericana del Atún ...
IATTC Fishery Status Report 8 - Comisión Interamericana del Atún ...

You also want an ePaper? Increase the reach of your titles
YUMPU automatically turns print PDFs into web optimized ePapers that Google loves.
14<br />
In early 1990 the U.S. tuna-canning industry adopted a policy of not purchasing tunas caught during trips during which sets on tunas<br />
associated with dolphins were made. This caused many U.S.-flag vessels to leave the EPO, with a consequent reduction in the fleet<br />
to about 117 thousand m 3 in 1992. With increases in participation of vessels of other nations in the fishery, the total well volume<br />
has increased steadily since 1992, and in 2009 was 224 thousand m 3 .<br />
The 2008 and preliminary 2009 data for numbers<br />
and total well volumes of purse-seine and poleand-line<br />
vessels that fished for tunas in the EPO<br />
are shown in Tables A-11a and A-11b. During<br />
2009, the fleet was dominated by vessels operating<br />
under the Ecuadorian and Mexican flags, with<br />
about 27% and 22%, respectively, of the total well<br />
volume; they were followed by Panama (14%),<br />
Venezuela (13%), Colombia (7%), Spain (4%), El<br />
Salvador and Nicaragua (3% each), and<br />
Guatemala, United States, and Vanuatu (2%).<br />
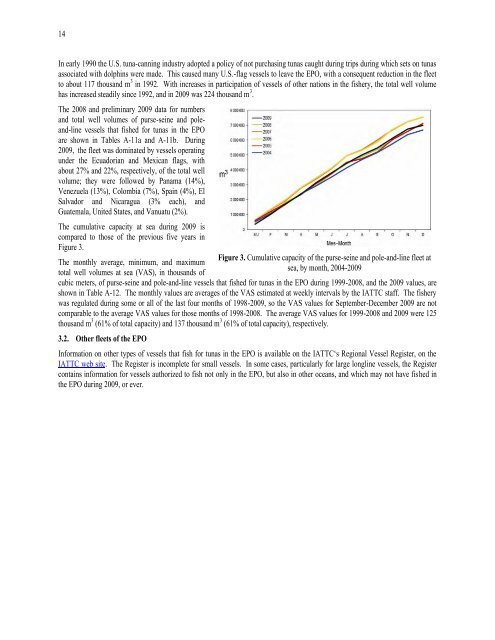
The cumulative capacity at sea during 2009 is<br />
compared to those of the previous five years in<br />
Figure 3.<br />
The monthly average, minimum, and maximum<br />
total well volumes at sea (VAS), in thousands of<br />
Figure 3. Cumulative capacity of the purse-seine and pole-and-line fleet at<br />
sea, by month, 2004-2009<br />
cubic meters, of purse-seine and pole-and-line vessels that fished for tunas in the EPO during 1999-2008, and the 2009 values, are<br />
shown in Table A-12. The monthly values are averages of the VAS estimated at weekly intervals by the <strong>IATTC</strong> staff. The fishery<br />
was regulated during some or all of the last four months of 1998-2009, so the VAS values for September-December 2009 are not<br />
comparable to the average VAS values for those months of 1998-2008. The average VAS values for 1999-2008 and 2009 were 125<br />
thousand m 3 (61% of total capacity) and 137 thousand m 3 (61% of total capacity), respectively.<br />
3.2. Other fleets of the EPO<br />
Information on other types of vessels that fish for tunas in the EPO is available on the <strong>IATTC</strong>‘s Regional Vessel Register, on the<br />
<strong>IATTC</strong> web site. The Register is incomplete for small vessels. In some cases, particularly for large longline vessels, the Register<br />
contains information for vessels authorized to fish not only in the EPO, but also in other oceans, and which may not have fished in<br />
the EPO during 2009, or ever.