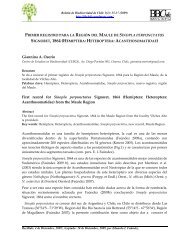
Morfometría Orchestoi<strong>de</strong>a tuberculata ______________________________________________________________________________________________ Figura 4. Regresión lineal entre la distancia geográfica y la distancia <strong>de</strong> Mahalanobis 2 <strong>de</strong> las cuatro poblaciones <strong>de</strong> O. tuberculata, sin distinción <strong>de</strong> sexos. Tabla 5. Coeficientes estandarizados <strong>de</strong> las funciones discriminantes obtenidas en machos. Función 1 Función 2 Función 3 LP4 0,41552 0,51955 -0,05799 LTE -0,42719 -0,98501 1,21767 DPR -0,71788 0,02250 -0,84480 AP1 -0,43059 0,91775 0,24355 LA1 0,29019 -0,51387 -0,01934 LG2 -0,58127 2,19725 -0,90762 L52 1,14853 -0,12852 0,14072 A32 -1,19714 -0,78234 1,84465 LP6 -0,49388 0,22828 -1,47170 LC -0,03927 -0,28197 0,26518 DSU 0,72252 -0,28414 -1,13038 AD 0,28236 -1,41732 -1,01270 LT 0,59290 0,93389 1,33755 LP1 -0,15356 -1,33507 -1,44140 HC 0,10781 -1,18597 0,23605 PL1 0,22115 1,89203 -0,11267 LA3 0,26231 -0,55907 0,69309 HOD 0,34494 0,46345 0,58951 BA2 -0,35676 0,44186 -0,53437 LP7 -0,23711 -0,89989 1,15513 AP7 -0,00298 -0,86942 -3,82774 AP5 -0,05355 -2,05084 2,05367 PG2 0,08248 1,82641 -2,51836 LFA -0,37593 -1,47663 -1,94389 BP2 -0,06163 -1,58434 -1,53311 LD -0,33368 0,50482 2,11897 A42 -0,13887 -0,39320 -1,66593 HG6 -0,97772 0,08291 1,86879 LP2 -0,65904 0,19323 0,63691 L42 1,00979 1,29864 1,06829 AP6 0,09569 2,29075 1,42162 PL3 -0,13364 -0,60142 0,28826 Eigenvalue 20,77684 12,77259 3,24040 % 56,474 91,192 100,000 29
Pérez-Schultheiss ______________________________________________________________________________________________ <strong>de</strong> la región cefálica (DPR, A32, L52, L42 y DSU), gnatópodo (LG2 y HG6) y la longitud total (LT). La segunda función, que explica un 35% (p