En nuestro Canal de Emprendimientos, encontrará todo lo que debe ...
En nuestro Canal de Emprendimientos, encontrará todo lo que debe ...
En nuestro Canal de Emprendimientos, encontrará todo lo que debe ...

You also want an ePaper? Increase the reach of your titles
YUMPU automatically turns print PDFs into web optimized ePapers that Google loves.
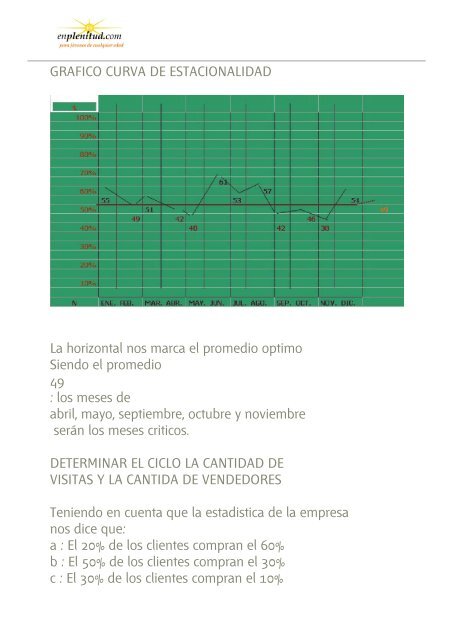
GRAFICO CURVA DE ESTACIONALIDAD<br />
La horizontal nos marca el promedio optimo<br />
Siendo el promedio<br />
49<br />
: <strong>lo</strong>s meses <strong>de</strong><br />
abril, mayo, septiembre, octubre y noviembre<br />
serán <strong>lo</strong>s meses criticos.<br />
DETERMINAR EL CICLO LA CANTIDAD DE<br />
VISITAS Y LA CANTIDA DE VENDEDORES<br />
Teniendo en cuenta <strong>que</strong> la estadistica <strong>de</strong> la empresa<br />
nos dice <strong>que</strong>:<br />
a : El 20% <strong>de</strong> <strong>lo</strong>s clientes compran el 60%<br />
b : El 50% <strong>de</strong> <strong>lo</strong>s clientes compran el 30%<br />
c : El 30% <strong>de</strong> <strong>lo</strong>s clientes compran el 10%