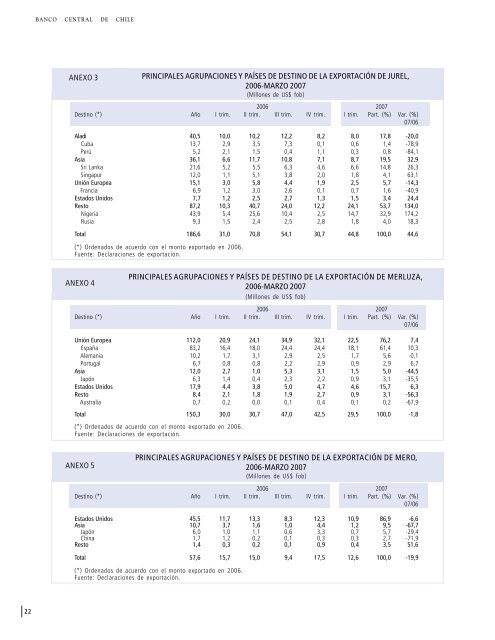
BANCO CENTRAL DE CHILEANEXO 3PRINCIPALES AGRUPACIONES Y PAÍSES DE DESTINO DE LA EXPORTACIÓN DE JUREL,2006-MARZO 2007(Millones <strong>de</strong> US$ fob)2006 2007Destino (*) Año I trim. II trim. III trim. IV trim. I trim. Part. (%) Var. (%)07/06Aladi 40,5 10,0 10,2 12,2 8,2 8,0 17,8 -20,0Cuba 13,7 2,9 3,5 7,3 0,1 0,6 1,4 -78,9Perú 5,2 2,1 1,5 0,4 1,1 0,3 0,8 -84,1Asia 36,1 6,6 11,7 10,8 7,1 8,7 19,5 32,9Sri Lanka 21,6 5,2 5,5 6,3 4,6 6,6 14,8 26,3Singapur 12,0 1,1 5,1 3,8 2,0 1,8 4,1 63,1Unión Europea 15,1 3,0 5,8 4,4 1,9 2,5 5,7 -14,3Francia 6,9 1,2 3,0 2,6 0,1 0,7 1,6 -40,9Estados Unidos 7,7 1,2 2,5 2,7 1,3 1,5 3,4 24,4Resto 87,2 10,3 40,7 24,0 12,2 24,1 53,7 134,0Nigeria 43,9 5,4 25,6 10,4 2,5 14,7 32,9 174,2Rusia 9,3 1,5 2,4 2,5 2,8 1,8 4,0 18,3Total 186,6 31,0 70,8 54,1 30,7 44,8 100,0 44,6(*) Or<strong>de</strong>nados <strong>de</strong> acuerdo con el monto exportado en 2006.Fuente: Declaraciones <strong>de</strong> exportación.ANEXO 4PRINCIPALES AGRUPACIONES Y PAÍSES DE DESTINO DE LA EXPORTACIÓN DE MERLUZA,2006-MARZO 2007(Millones <strong>de</strong> US$ fob)2006 2007Destino (*) Año I trim. II trim. III trim. IV trim. I trim. Part. (%) Var. (%)07/06Unión Europea 112,0 20,9 24,1 34,9 32,1 22,5 76,2 7,4España 83,2 16,4 18,0 24,4 24,4 18,1 61,4 10,3Alemania 10,2 1,7 3,1 2,9 2,5 1,7 5,6 -0,1Portugal 6,7 0,8 0,8 2,2 2,9 0,9 2,9 6,7Asia 12,0 2,7 1,0 5,3 3,1 1,5 5,0 -44,5Japón 6,3 1,4 0,4 2,3 2,2 0,9 3,1 -35,5Estados Unidos 17,9 4,4 3,8 5,0 4,7 4,6 15,7 6,3Resto 8,4 2,1 1,8 1,9 2,7 0,9 3,1 -56,3Australia 0,7 0,2 0,0 0,1 0,4 0,1 0,2 -67,9Total 150,3 30,0 30,7 47,0 42,5 29,5 100,0 -1,8(*) Or<strong>de</strong>nados <strong>de</strong> acuerdo con el monto exportado en 2006.Fuente: Declaraciones <strong>de</strong> exportación.ANEXO 5PRINCIPALES AGRUPACIONES Y PAÍSES DE DESTINO DE LA EXPORTACIÓN DE MERO,2006-MARZO 2007(Millones <strong>de</strong> US$ fob)2006 2007Destino (*) Año I trim. II trim. III trim. IV trim. I trim. Part. (%) Var. (%)07/06Estados Unidos 45,5 11,7 13,3 8,3 12,3 10,9 86,9 -6,6Asia 10,7 3,7 1,6 1,0 4,4 1,2 9,5 -67,7Japón 6,0 1,0 1,1 0,6 3,3 0,7 5,7 -29,4China 1,7 1,2 0,2 0,1 0,3 0,3 2,7 -71,9Resto 1,4 0,3 0,2 0,1 0,9 0,4 3,5 51,6Total 57,6 15,7 15,0 9,4 17,5 12,6 100,0 -19,9(*) Or<strong>de</strong>nados <strong>de</strong> acuerdo con el monto exportado en 2006.Fuente: Declaraciones <strong>de</strong> exportación.22
Indicadores <strong>de</strong> Comercio Exterior • <strong>Primer</strong> Trimestre <strong>de</strong> 2007ANEXO 6PRINCIPALES AGRUPACIONES Y PAÍSES DE DESTINO DE LA EXPORTACIÓN DE HARINA DE PESCADO,2006-MARZO 2007(Millones <strong>de</strong> US$ fob)2006 2007Destino (*) Año I trim. II trim. III trim. IV trim. I trim. Part. (%) Var. (%)07/06Asia 373,8 47,6 148,3 112,5 65,4 107,9 73,6 126,6China 171,3 14,4 74,2 50,5 32,1 50,8 34,6 252,0Japón 82,7 10,8 25,9 34,0 12,0 26,4 18,0 145,5Taiwán 45,5 9,1 17,3 9,1 10,0 10,9 7,5 19,8Unión Europea 105,4 19,9 30,6 29,9 25,0 33,7 23,0 69,0Alemania 36,3 6,8 7,7 13,2 8,6 8,3 5,7 21,2España 27,5 5,3 7,9 7,9 6,4 9,7 6,6 83,8Italia 25,3 3,3 11,6 3,1 7,3 6,3 4,3 88,9Resto 18,5 7,0 4,8 4,1 2,6 5,0 3,4 -28,9Total 497,7 74,6 183,7 146,5 93,0 146,6 100,0 96,6(*) Or<strong>de</strong>nados <strong>de</strong> acuerdo con el monto exportado en 2006.Fuente: Declaraciones <strong>de</strong> exportación.ANEXO 7PRINCIPALES AGRUPACIONES Y PAÍSES DE DESTINO DE LA EXPORTACIÓN DE MOLUSCOS Y CRUSTÁCEOS,2006-MARZO 2007(Millones <strong>de</strong> US$ fob)2006 2007Destino (*) Año I trim. II trim. III trim. IV trim. I trim. Part. (%) Var. (%)07/06Asia 121,9 10,4 27,0 49,5 34,9 13,8 23,7 32,2Japón 69,5 3,3 17,1 33,0 16,0 3,9 6,6 16,1China 19,7 2,9 3,8 6,7 6,3 3,0 5,2 5,0Taiwán 15,4 1,7 1,7 5,3 6,7 3,3 5,7 99,0Singapur 5,0 0,6 1,6 1,1 1,6 1,4 2,5 148,8Unión Europea 144,7 37,1 38,0 32,3 37,4 35,5 61,0 -4,1España 66,8 16,5 20,9 15,1 14,3 16,0 27,4 -3,2Francia 38,7 11,6 5,9 7,3 13,8 8,3 14,2 -29,0Estados Unidos 27,3 4,6 7,7 8,1 6,9 5,3 9,2 15,1Aladi 8,2 2,0 2,0 2,7 1,6 2,0 3,4 1,2Resto 5,9 1,3 1,8 1,4 1,4 1,6 2,8 24,7Total 308,1 55,4 76,5 94,0 82,2 58,3 100,0 5,2(*) Or<strong>de</strong>nados <strong>de</strong> acuerdo con el monto exportado en 2006.Fuente: Declaraciones <strong>de</strong> exportación.ANEXO 8PRINCIPALES AGRUPACIONES Y PAÍSES DE DESTINO DE LA EXPORTACIÓN DE OTROS PRODUCTOS DEL MAR,2006-MARZO 2007(Millones <strong>de</strong> US$ fob)2006 2007Destino (*) Año I trim. II trim. III trim. IV trim. I trim. Part. (%) Var. (%)07/06Asia 86,4 26,8 25,9 20,9 12,7 20,3 58,9 -24,4Japón 33,4 9,1 9,8 8,4 6,0 7,9 23,1 -13,1China 16,8 5,1 4,9 4,2 2,5 5,8 17,0 13,5Tailandia 11,5 4,6 3,2 2,4 1,3 2,2 6,4 -52,7Unión Europea 23,7 4,5 4,1 3,4 11,7 5,0 14,4 10,2Dinamarca 14,6 1,5 1,2 1,5 10,3 1,9 5,4 21,6Francia 3,4 1,5 1,2 0,3 0,5 1,6 4,7 8,0Estados Unidos 10,2 2,0 2,1 4,1 2,0 3,7 10,7 80,7Resto 19,3 5,0 5,2 4,7 4,3 5,5 15,9 9,2Total 139,5 38,4 37,3 33,1 30,7 34,4 100,0 -10,4(*) Or<strong>de</strong>nados <strong>de</strong> acuerdo con el monto exportado en 2006.Fuente: Declaraciones <strong>de</strong> exportación.23
- Page 2 and 3: ContenidoI RESUMEN DEL COMERCIO EXT
- Page 4 and 5: Indicadores de Comercio Exterior
- Page 6 and 7: II. Estudio
- Page 8 and 9: BANCO CENTRAL DE CHILECUADRO 1EXPOR
- Page 10 and 11: BANCO CENTRAL DE CHILECUADRO 3EXPOR
- Page 12 and 13: BANCO CENTRAL DE CHILELa exportaci
- Page 14 and 15: BANCO CENTRAL DE CHILECUADRO 8EXPOR
- Page 16 and 17: BANCO CENTRAL DE CHILEEn el primer
- Page 20 and 21: Composición de las Claves de los P
- Page 22 and 23: Indicadores de Comercio Exterior
- Page 24 and 25: Indicadores de Comercio Exterior
- Page 26 and 27: Indicadores de Comercio Exterior
- Page 28 and 29: Indicadores de Comercio Exterior
- Page 30 and 31: Indicadores de Comercio Exterior
- Page 32 and 33: Indicadores de Comercio Exterior
- Page 34 and 35: Indicadores de Comercio Exterior
- Page 36 and 37: Indicadores de Comercio Exterior
- Page 38 and 39: Indicadores de Comercio Exterior
- Page 40 and 41: Indicadores de Comercio Exterior
- Page 42 and 43: Indicadores de Comercio Exterior
- Page 44 and 45: Indicadores de Comercio Exterior
- Page 46 and 47: Indicadores de Comercio Exterior
- Page 48 and 49: Indicadores de Comercio Exterior
- Page 50 and 51: Indicadores de Comercio Exterior
- Page 52 and 53: Indicadores de Comercio Exterior
- Page 54 and 55: Indicadores de Comercio Exterior
- Page 56 and 57: Indicadores de Comercio Exterior
- Page 58 and 59: Indicadores de Comercio Exterior
- Page 60 and 61: Indicadores de Comercio Exterior
- Page 62 and 63: Indicadores de Comercio Exterior
- Page 64 and 65: Indicadores de Comercio Exterior
- Page 66 and 67: Indicadores de Comercio Exterior
- Page 68 and 69:
Indicadores de Comercio Exterior
- Page 70 and 71:
Indicadores de Comercio Exterior
- Page 72 and 73:
Indicadores de Comercio Exterior
- Page 74 and 75:
Indicadores de Comercio Exterior
- Page 76 and 77:
Indicadores de Comercio Exterior
- Page 78 and 79:
Indicadores de Comercio Exterior
- Page 80 and 81:
Indicadores de Comercio Exterior
- Page 82 and 83:
Exportaciones
- Page 84 and 85:
BANCO CENTRAL DE CHILEEXPORTACIONES
- Page 86 and 87:
BANCO CENTRAL DE CHILEEXPORTACIÓN
- Page 88 and 89:
BANCO CENTRAL DE CHILEEXPORTACIÓN
- Page 90 and 91:
BANCO CENTRAL DE CHILEEXPORTACIÓN
- Page 92 and 93:
BANCO CENTRAL DE CHILEEXPORTACIÓN
- Page 94 and 95:
BANCO CENTRAL DE CHILEEXPORTACIÓN
- Page 96 and 97:
BANCO CENTRAL DE CHILEEXPORTACIÓN
- Page 98 and 99:
BANCO CENTRAL DE CHILEEXPORTACIÓN
- Page 100 and 101:
BANCO CENTRAL DE CHILEEXPORTACIÓN
- Page 102 and 103:
BANCO CENTRAL DE CHILEEXPORTACIÓN
- Page 104 and 105:
BANCO CENTRAL DE CHILEEXPORTACIÓN
- Page 106 and 107:
BANCO CENTRAL DE CHILE(Continuació
- Page 108 and 109:
Importaciones
- Page 110 and 111:
BANCO CENTRAL DE CHILEIMPORTACIONES
- Page 112 and 113:
BANCO CENTRAL DE CHILEIMPORTACIÓN
- Page 114 and 115:
BANCO CENTRAL DE CHILEIMPORTACIÓN
- Page 116 and 117:
BANCO CENTRAL DE CHILEIMPORTACIÓN
- Page 118 and 119:
BANCO CENTRAL DE CHILEIMPORTACIÓN
- Page 120 and 121:
BANCO CENTRAL DE CHILEIMPORTACIÓN
- Page 122 and 123:
BANCO CENTRAL DE CHILEIMPORTACIÓN
- Page 124 and 125:
BANCO CENTRAL DE CHILEIMPORTACIÓN
- Page 126 and 127:
BANCO CENTRAL DE CHILEIMPORTACIÓN
- Page 128 and 129:
BANCO CENTRAL DE CHILEIMPORTACIÓN
- Page 130 and 131:
BANCO CENTRAL DE CHILEIMPORTACIÓN
- Page 132 and 133:
BANCO CENTRAL DE CHILEIMPORTACIÓN
- Page 134 and 135:
BANCO CENTRAL DE CHILEIMPORTACIÓN
- Page 136 and 137:
BANCO CENTRAL DE CHILEIMPORTACIÓN
- Page 138 and 139:
BANCO CENTRAL DE CHILEIMPORTACIÓN
- Page 140 and 141:
BANCO CENTRAL DE CHILEIMPORTACIÓN
- Page 142 and 143:
BANCO CENTRAL DE CHILEIMPORTACIÓN
- Page 144 and 145:
BANCO CENTRAL DE CHILEIMPORTACIÓN
- Page 146 and 147:
BANCO CENTRAL DE CHILEIMPORTACIÓN
- Page 148 and 149:
BANCO CENTRAL DE CHILEIMPORTACIÓN
- Page 150 and 151:
BANCO CENTRAL DE CHILEIMPORTACIÓN
- Page 152 and 153:
BANCO CENTRAL DE CHILE(Continuació
- Page 154 and 155:
IV. Estadísticas de Comercio Exter
- Page 156 and 157:
BANCO CENTRAL DE CHILEIMPORTACIONES
- Page 158 and 159:
BANCO CENTRAL DE CHILEPRINCIPALES P
- Page 160 and 161:
América
- Page 162 and 163:
BANCO CENTRAL DE CHILEPRINCIPALES P
- Page 164 and 165:
BANCO CENTRAL DE CHILE(Continuació
- Page 166 and 167:
BANCO CENTRAL DE CHILE(Continuació
- Page 168 and 169:
BANCO CENTRAL DE CHILE(Continuació
- Page 170 and 171:
BANCO CENTRAL DE CHILE(Continuació
- Page 172 and 173:
BANCO CENTRAL DE CHILE(Continuació
- Page 174 and 175:
BANCO CENTRAL DE CHILE(Continuació
- Page 176 and 177:
BANCO CENTRAL DE CHILE(Continuació
- Page 178 and 179:
BANCO CENTRAL DE CHILE(Continuació
- Page 180 and 181:
BANCO CENTRAL DE CHILE(Continuació
- Page 182 and 183:
BANCO CENTRAL DE CHILEPRINCIPALES P
- Page 184 and 185:
BANCO CENTRAL DE CHILE(Continuació
- Page 186 and 187:
BANCO CENTRAL DE CHILEPRINCIPALES P
- Page 188 and 189:
Europa
- Page 190 and 191:
BANCO CENTRAL DE CHILEPRINCIPALES P
- Page 192 and 193:
BANCO CENTRAL DE CHILE(Continuació
- Page 194 and 195:
BANCO CENTRAL DE CHILE(Continuació
- Page 196 and 197:
BANCO CENTRAL DE CHILE(Continuació
- Page 198 and 199:
BANCO CENTRAL DE CHILEPRINCIPALES P
- Page 200 and 201:
BANCO CENTRAL DE CHILE(Continuació
- Page 202 and 203:
BANCO CENTRAL DE CHILE(Continuació
- Page 204 and 205:
BANCO CENTRAL DE CHILE(Continuació
- Page 206 and 207:
BANCO CENTRAL DE CHILE(Continuació
- Page 208 and 209:
BANCO CENTRAL DE CHILE(Continuació
- Page 210 and 211:
BANCO CENTRAL DE CHILEPRINCIPALES P
- Page 212 and 213:
BANCO CENTRAL DE CHILE(Continuació
- Page 214 and 215:
BANCO CENTRAL DE CHILEPRINCIPALES P
- Page 216 and 217:
BANCO CENTRAL DE CHILE(Continuació
- Page 218 and 219:
BANCO CENTRAL DE CHILEPRINCIPALES P
- Page 220 and 221:
BANCO CENTRAL DE CHILE(Continuació
- Page 222 and 223:
BANCO CENTRAL DE CHILE(Continuació
- Page 224 and 225:
BANCO CENTRAL DE CHILE(Continuació
- Page 226 and 227:
BANCO CENTRAL DE CHILE(Continuació
- Page 228 and 229:
BANCO CENTRAL DE CHILE(Continuació
- Page 230 and 231:
BANCO CENTRAL DE CHILE(Continuació
- Page 232 and 233:
BANCO CENTRAL DE CHILE(Continuació
- Page 234 and 235:
Indicadores de Comercio Exterior
- Page 236 and 237:
Indicadores de Comercio Exterior
- Page 238 and 239:
Indicadores de Comercio Exterior
- Page 240 and 241:
Indicadores de Comercio Exterior
- Page 242 and 243:
Indicadores de Comercio Exterior
- Page 244 and 245:
Indicadores de Comercio Exterior
- Page 246 and 247:
Indicadores de Comercio Exterior
- Page 248 and 249:
Indicadores de Comercio Exterior
- Page 250 and 251:
Indicadores de Comercio Exterior
- Page 252 and 253:
Indicadores de Comercio Exterior
- Page 254 and 255:
Indicadores de Comercio Exterior
- Page 256 and 257:
Indicadores de Comercio Exterior
- Page 258 and 259:
Indicadores de Comercio Exterior
- Page 260 and 261:
África
- Page 262 and 263:
BANCO CENTRAL DE CHILECÓDIGODESCRI
- Page 264 and 265:
BANCO CENTRAL DE CHILE(Continuació
- Page 266 and 267:
Indicadores de Comercio Exterior
- Page 268 and 269:
Indicadores de Comercio Exterior
- Page 270 and 271:
Indicadores de Comercio Exterior
- Page 272:
Publicación editada por el Departa