

de Viajes Santiago
presentacion_eodstgo_2012_final
presentacion_eodstgo_2012_final

Create successful ePaper yourself
Turn your PDF publications into a flip-book with our unique Google optimized e-Paper software.
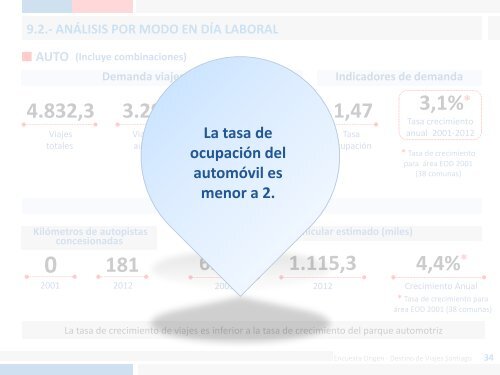
9.2.- ANÁLISIS POR MODO EN DÍA LABORAL<br />
AUTO<br />
4.832,3<br />
<strong>Viajes</strong><br />
totales<br />
(Incluye combinaciones)<br />
Demanda viajes (miles)<br />
3.296,8<br />
<strong>Viajes</strong> como<br />
auto chofer<br />
1.535,5<br />
La tasa <strong>de</strong><br />
ocupación <strong>de</strong>l<br />
automóvil es<br />
menor a 2.<br />
<strong>Viajes</strong> como auto<br />
acompañante<br />
Datos <strong>de</strong> oferta<br />
Indicadores <strong>de</strong> <strong>de</strong>manda<br />
1,47<br />
Tasa<br />
ocupación<br />
3,1% *<br />
Tasa crecimiento<br />
anual 2001-2012<br />
* Tasa <strong>de</strong> crecimiento<br />
para área EOD 2001<br />
(38 comunas)<br />
Kilómetros <strong>de</strong> autopistas<br />
concesionadas<br />
181<br />
0<br />
2001 2012<br />
697,8<br />
2001<br />
Parque vehicular estimado (miles)<br />
1.115,3<br />
2012<br />
4,4% *<br />
Crecimiento Anual<br />
* Tasa <strong>de</strong> crecimiento para<br />
área EOD 2001 (38 comunas)<br />
La tasa <strong>de</strong> crecimiento <strong>de</strong> viajes es inferior a la tasa <strong>de</strong> crecimiento <strong>de</strong>l parque automotriz<br />
Encuesta Origen - Destino <strong>de</strong> <strong>Viajes</strong> <strong>Santiago</strong> 34