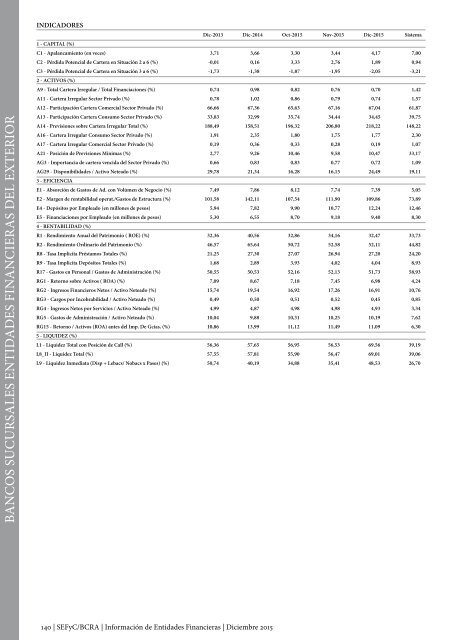
BANCOS SUCURSALES ENTIDADES FINANCIERAS DEL EXTERIOR INDICADORES Dic-2013 Dic-2014 Oct-2015 Nov-2015 Dic-2015 Sistema 1 - CAPITAL (%) C1 - Apalancamiento (en veces) 3,71 3,66 3,30 3,44 4,17 7,00 C2 - Pérdida Potencial <strong>de</strong> Cartera en Situación 2 a 6 (%) -0,01 0,16 3,33 2,76 1,89 0,94 C3 - Pérdida Potencial <strong>de</strong> Cartera en Situación 3 a 6 (%) -1,73 -1,38 -1,87 -1,95 -2,05 -3,21 2 - ACTIVOS (%) A9 - Total Cartera Irregular / Total Financiaciones (%) 0,74 0,98 0,82 0,76 0,70 1,42 A11 - Cartera Irregular Sector Privado (%) 0,78 1,02 0,86 0,79 0,74 1,57 A12 - Participación Cartera Comercial Sector Privado (%) 66,66 67,36 65,63 67,16 67,04 61,87 A13 - Participación Cartera Consumo Sector Privado (%) 33,83 32,99 35,74 34,44 34,45 39,75 A14 - Previsiones sobre Cartera Irregular Total (%) 188,49 158,51 196,32 206,80 218,22 148,22 A16 - Cartera Irregular Consumo Sector Privado (%) 1,91 2,35 1,80 1,75 1,77 2,30 A17 - Cartera Irregular Comercial Sector Privado (%) 0,19 0,36 0,33 0,28 0,19 1,07 A21 - Posición <strong>de</strong> Previsiones Mínimas (%) 2,77 9,26 10,46 9,58 10,47 33,17 AG3 - Importancia <strong>de</strong> cartera vencida <strong>de</strong>l Sector Privado (%) 0,66 0,83 0,83 0,77 0,72 1,09 AG29 - Disponibilida<strong>de</strong>s / Activo Neteado (%) 29,78 21,34 16,28 16,15 24,49 19,11 3 - EFICIENCIA E1 - Absorción <strong>de</strong> Gastos <strong>de</strong> Ad. con Volúmen <strong>de</strong> Negocio (%) 7,49 7,86 8,12 7,74 7,39 5,05 E2 - Margen <strong>de</strong> rentabilidad operat./Gastos <strong>de</strong> Estructura (%) 101,58 142,11 107,54 111,90 109,86 73,89 E4 - Depósitos por Empleado (en millones <strong>de</strong> pesos) 5,94 7,82 9,90 10,77 12,24 12,46 E5 - Financiaciones por Empleado (en millones <strong>de</strong> pesos) 5,30 6,55 8,70 9,18 9,40 8,30 4 - RENTABILIDAD (%) R1 - Rendimiento Anual <strong>de</strong>l Patrimonio ( ROE) (%) 32,36 40,56 32,86 34,16 32,47 33,73 R2 - Rendimiento Ordinario <strong>de</strong>l Patrimonio (%) 46,57 65,64 50,72 52,58 52,11 44,82 R8 - Tasa Implicita Préstamos Totales (%) 21,25 27,30 27,07 26,94 27,20 24,20 R9 - Tasa Implicita Depósitos Totales (%) 1,68 2,89 3,93 4,02 4,04 8,93 R17 - Gastos en Personal / Gastos <strong>de</strong> Administración (%) 50,55 50,53 52,16 52,13 51,73 58,93 RG1 - Retorno sobre Activos ( ROA) (%) 7,09 8,67 7,18 7,45 6,98 4,24 RG2 - Ingresos Financieros Netos / Activo Neteado (%) 15,74 19,54 16,92 17,26 16,91 10,76 RG3 - Cargos por Incobrabilidad / Activo Neteado (%) 0,49 0,50 0,51 0,52 0,45 0,85 RG4 - Ingresos Netos por Servicios / Activo Neteado (%) 4,99 4,87 4,98 4,98 4,93 3,34 RG5 - Gastos <strong>de</strong> Administración / Activo Neteado (%) 10,04 9,88 10,31 10,25 10,19 7,62 RG15 - Retorno / Activos (ROA) antes <strong>de</strong>l Imp. De Gcias. (%) 10,86 13,99 11,12 11,49 11,09 6,30 5 - LIQUIDEZ (%) L1 - Liqui<strong>de</strong>z Total con Posición <strong>de</strong> Call (%) 56,36 57,65 56,95 56,53 69,56 39,19 L8_II - Liqui<strong>de</strong>z Total (%) 57,55 57,81 55,90 56,47 69,01 39,06 L9 - Liqui<strong>de</strong>z Inmediata (Disp + Lebacs/ Nobacs x Pases) (%) 50,74 40,19 34,88 35,41 48,53 26,70 140 | SEFyC/BCRA | <strong>Información</strong> <strong>de</strong> Entida<strong>de</strong>s <strong>Financieras</strong> | Diciembre 2015
INFORMACIÓN ADICIONAL Dic-2013 Dic-2014 Jun-2015 Set-2015 Dic-2015 Cantidad <strong>de</strong> cuentas corrientes 139.226 135.873 136.756 138.178 140.076 Cantidad <strong>de</strong> cuentas <strong>de</strong> ahorro 357.524 306.215 301.222 312.247 322.212 Cantidad <strong>de</strong> operaciones a plazo fijo Individuos 18.023 26.504 26.314 24.968 22.637 Cantidad <strong>de</strong> operaciones a plazo fijo Empresas 236 379 538 682 681 Cantidad <strong>de</strong> operaciones por préstamos Individuos 309.326 306.735 302.525 308.327 314.253 Cantidad <strong>de</strong> operaciones por préstamos Empresas 30.178 20.139 18.969 15.410 11.520 Dotación <strong>de</strong> personal 3.163 3.166 3.119 3.106 3.230 Cantidad <strong>de</strong> titulares por tarjetas <strong>de</strong> crédito 506.554 520.804 531.880 524.552 535.028 Cantidad <strong>de</strong> tarjetas <strong>de</strong> crédito (plásticos) 790.503 816.334 827.008 835.536 841.932 Cantidad <strong>de</strong> cuentas con tarjetas <strong>de</strong> débito 582.146 565.176 555.362 569.844 577.339 Cantidad <strong>de</strong> tarjetas <strong>de</strong> débito 345.417 320.682 316.072 322.093 324.535 Cantidad <strong>de</strong> cheques librados por cuentacorrentistas 124.998 114.230 124.184 123.785 119.734 Monto pagado por cheques librados 11.974.103 15.908.494 18.751.125 20.702.627 22.902.010 PAGO DE REMUNERACIONES MEDIANTE ACREDITACIÓN BANCARIA Dic-2013 Dic-2014 Oct-2015 Nov-2015 Dic-2015 Cantidad <strong>de</strong> Cuentas 101.860 102.766 102.190 100.672 103.631 Cantidad <strong>de</strong> Empresas 3.373 3.639 3.695 3.648 3.766 ESTADO DE SITUACIÓN DE DEUDORES Dic-2013 Dic-2014 Oct-2015 Nov-2015 Dic-2015 TOTAL DE FINANCIACIONES Y GARANTIAS OTORGADAS 17.721,8 22.327,1 28.538,7 30.064,8 31.061,6 Sit.1: En situación normal 98,60% 98,38% 96,99% 97,28% 97,69% Sit.2: Con seguimiento especial/Riesgo bajo 0,65% 0,64% 2,20% 1,96% 1,60% Sit.3: Con problemas/Riesgo medio 0,33% 0,49% 0,29% 0,27% 0,23% Sit.4: Con alto riesgo <strong>de</strong> insolvencia/Riesgo alto 0,25% 0,34% 0,36% 0,33% 0,30% Sit.5: Irrecuperable 0,16% 0,14% 0,17% 0,16% 0,18% Sit.6: Irrecuperable por disposición técnica 0,00% 0,00% 0,00% 0,00% 0,00% TOTAL GARANTIZADO - Garantías Preferidas A y B 9,46% 7,08% 6,62% 7,00% 7,65% Sit.1: En situación normal 9,36% 7,06% 6,54% 6,92% 7,59% Sit.2: Con seguimiento especial/Riesgo bajo 0,10% 0,02% 0,01% 0,03% 0,02% Sit.3: Con problemas/Riesgo medio 0,00% 0,00% 0,00% 0,00% 0,00% Sit.4: Con alto riesgo <strong>de</strong> insolvencia/Riesgo alto 0,00% 0,00% 0,06% 0,05% 0,04% Sit.5: Irrecuperable 0,00% 0,00% 0,00% 0,00% 0,00% Sit.6: Irrecuperable por disposición técnica 0,00% 0,00% 0,00% 0,00% 0,00% TOTAL DE GARANTIAS OTORGADAS 1,28% 1,98% 0,91% 0,81% 1,66% COMPOSICIÓN DE CARTERA Dic-2013 Dic-2014 Oct-2015 Nov-2015 Dic-2015 CARTERA COMERCIAL Monto 11.865,9 14.963,4 18.501,7 19.817,0 20.520,7 % sobre Financiaciones 66,96% 67,02% 64,83% 65,91% 66,06% Garantías otorgadas 1,22% 1,92% 0,90% 0,80% 1,66% Total Garantizado - Garantías Preferidas A y B 9,03% 6,59% 6,31% 6,71% 7,36% CARTERA DE CONSUMO O VIVIENDA Monto 5.735,3 7.091,2 9.729,7 9.939,7 10.222,1 % sobre Financiaciones 32,36% 31,76% 34,09% 33,06% 32,91% Garantías otorgadas 0,00% 0,00% 0,00% 0,00% 0,00% Total Garantizado - Garantías Preferidas A y B 0,37% 0,28% 0,19% 0,18% 0,17% CARTERA COMERCIAL ASIMILABLE A CONSUMO Monto 120,6 272,5 307,3 308,1 318,7 % sobre Financiaciones 0,68% 1,22% 1,08% 1,02% 1,03% Garantías otorgadas 0,06% 0,06% 0,02% 0,01% 0,01% Total Garantizado - Garantías Preferidas A y B 0,05% 0,21% 0,12% 0,11% 0,12% Previsiones por riesgo <strong>de</strong> incobrabilidad constituídas 248,4 346,5 458,4 473,2 477,7 BANCOS SUCURSALES ENTIDADES FINANCIERAS DEL EXTERIOR Diciembre 2015 | <strong>Información</strong> <strong>de</strong> Entida<strong>de</strong>s <strong>Financieras</strong> | SEFyC/BCRA | 141
- Page 1:
Información de Entidades Financier
- Page 4 and 5:
Información de Entidades Financier
- Page 6 and 7:
4 | SEFyC/BCRA | Información de En
- Page 8 and 9:
ÍNDICE BANCO INDUSTRIAL S.A. . . .
- Page 10 and 11:
8 | SEFyC/BCRA | Información de En
- Page 12 and 13:
I. RÉGIMEN MONETARIO Y CAMBIARIO 1
- Page 14 and 15:
Mercadería rechazada total o parci
- Page 16 and 17:
Que no existan deudas pendientes po
- Page 18 and 19:
específicamente en la normativa ca
- Page 20 and 21:
1.e.iii. Constitución de depósito
- Page 22 and 23:
1. Inversiones registradas en el ru
- Page 24 and 25:
La Resolución MEyFP N° 661/13 (B.
- Page 26 and 27:
Abarca tanto a las operaciones pend
- Page 28 and 29:
cambios en concepto de pagos de imp
- Page 30 and 31:
En los casos de viajes con destinos
- Page 32 and 33:
Se requiere la conformidad previa d
- Page 34 and 35:
2.e.iii. Acceso al mercado local de
- Page 36 and 37:
Las compras de divisas y las compra
- Page 38 and 39:
demás parámetros cuantitativos qu
- Page 40 and 41:
Los préstamos que otorguen entidad
- Page 42 and 43:
corresponde la acreditación de los
- Page 44 and 45:
A. Riesgo de Crédito La exigencia
- Page 46 and 47:
Concepto Tasa Exposiciones incluida
- Page 48 and 49:
donde: C RO : exigencia de capital
- Page 50 and 51:
cliente el flujo de fondos, los est
- Page 52 and 53:
En forma global, la asistencia al s
- Page 54 and 55:
RPC, y los préstamos de hasta $50.
- Page 56 and 57:
4. El devengamiento de intereses de
- Page 58 and 59:
Operaciones En pesos Categorías Ca
- Page 60 and 61:
están sujetas a un cargo equivalen
- Page 62 and 63:
a) Prefinanciación y financiación
- Page 64 and 65:
todo el personal, conforme las disp
- Page 66 and 67:
• Riesgo medio: los prestatarios
- Page 68 and 69:
a través del sujeto obligado, etc.
- Page 70 and 71:
Directivos y Gerentes Las entidades
- Page 72 and 73:
determinados servicios , dependenci
- Page 74 and 75:
Además, mantiene el principio bás
- Page 76 and 77:
orismo al Código Penal, aumentando
- Page 78 and 79:
En lo que respecta a las bases de d
- Page 80 and 81:
• La verificación de los deudore
- Page 82 and 83:
que se encuentran garantizados para
- Page 84 and 85:
lidades Eventuales y con respecto a
- Page 86 and 87:
correspondientes a deudores/acreedo
- Page 88 and 89:
* Indicadores: período mensual cor
- Page 90 and 91:
Resultado Desfasado 1 mes] R8-Tasa
- Page 92 and 93: 90 | SEFyC/BCRA | Información de E
- Page 94 and 95: SISTEMA FINANCIERO EVOLUCIÓN DE ES
- Page 96 and 97: INFORMACIÓN ADICIONAL Dic-2013 Dic
- Page 98 and 99: SISTEMA FINANCIERO 100 PRINCIPALES
- Page 100 and 101: SISTEMA FINANCIERO deudores del sis
- Page 102 and 103: SISTEMA FINANCIERO deudores del sis
- Page 104 and 105: MATRIZ DE TRANSICIÓN DE DEUDORES
- Page 106 and 107: SISTEMA FINANCIERO DEPOSITOS, OTRAS
- Page 108 and 109: SISTEMA FINANCIERO DEPOSITOS - PERS
- Page 110 and 111: SISTEMA FINANCIERO información so
- Page 112 and 113: SISTEMA FINANCIERO fideicomisos fin
- Page 114 and 115: BANCOS EVOLUCIÓN DE ESTADOS CONTAB
- Page 116 and 117: INFORMACIÓN ADICIONAL Dic-2013 Dic
- Page 118 and 119: ENTIDADES INTEGRANTES BANCO DE CORR
- Page 120 and 121: BANCOS PÚBLICOS INDICADORES Dic-20
- Page 122 and 123: BANCOS PÚBLICOS deudores del siste
- Page 124 and 125: 27 53 10 69 45 8 29 194 119 32 43 1
- Page 126 and 127: BANCOS PRIVADOS INDICADORES Dic-201
- Page 128 and 129: BANCOS PRIVADOS deudores del sistem
- Page 130 and 131: ENTIDADES INTEGRANTES BACS BANCO DE
- Page 132 and 133: BANCOS LOCALES DE CAPITAL NACIONAL
- Page 134 and 135: BANCOS locales DE CAPITAL NACIONAL
- Page 136 and 137: BANCOS LOCALES DE CAPITAL EXTRANJER
- Page 138 and 139: INFORMACIÓN ADICIONAL Dic-2013 Dic
- Page 140 and 141: ENTIDADES INTEGRANTES BANCO DE LA R
- Page 144 and 145: ancos sucursales de entidades finan
- Page 146 and 147: COMPAÑÍAS FINANCIERAS EVOLUCIÓN
- Page 148 and 149: INFORMACIÓN ADICIONAL Dic-2013 Dic
- Page 150 and 151: ENTIDADES INTEGRANTES COMPAÑIA FIN
- Page 152 and 153: COMPAÑÍAS FINANCIERAS DE CAPITAL
- Page 154 and 155: compañias financIERAS de capital n
- Page 156 and 157: COMPAÑÍAS FINANCIERAS DE CAPITAL
- Page 158 and 159: COMPAÑÍAS FINANCIERAS DE CAPITAL
- Page 160 and 161: ENTIDADES INTEGRANTES CAJA DE CREDI
- Page 162 and 163: CAJAS DE CRÉDITO INDICADORES Dic-2
- Page 164 and 165: cajas de credito deudores del siste
- Page 166 and 167: 10 PRIMEROS BANCOS PRIVADOS EVOLUCI
- Page 168 and 169: INFORMACIÓN ADICIONAL Dic-2013 Dic
- Page 170 and 171: 168 | SEFyC/BCRA | Información de
- Page 172 and 173: BACS BANCO DE CREDITO Y SECURITIZAC
- Page 174 and 175: INFORMACIÓN ADICIONAL Dic-2013 Dic
- Page 176 and 177: BANCO BICA S.A. EVOLUCIÓN DE ESTAD
- Page 178 and 179: INFORMACIÓN ADICIONAL Jun-2014 Jun
- Page 180 and 181: BANCO BRADESCO ARGENTINA S.A. EVOLU
- Page 182 and 183: INFORMACIÓN ADICIONAL Dic-2013 Dic
- Page 184 and 185: BANCO CETELEM ARGENTINA S.A. EVOLUC
- Page 186 and 187: INFORMACIÓN ADICIONAL Dic-2013 Dic
- Page 188 and 189: BANCO CMF S.A. EVOLUCIÓN DE ESTADO
- Page 190 and 191: INFORMACIÓN ADICIONAL Dic-2013 Dic
- Page 192 and 193:
BANCO COINAG S.A. EVOLUCIÓN DE EST
- Page 194 and 195:
INFORMACIÓN ADICIONAL Dic-2014 Jun
- Page 196 and 197:
BANCO COLUMBIA S.A. EVOLUCIÓN DE E
- Page 198 and 199:
INFORMACIÓN ADICIONAL Jun-2013 Jun
- Page 200 and 201:
BANCO COMAFI SOCIEDAD ANONIMA EVOLU
- Page 202 and 203:
INFORMACIÓN ADICIONAL Jun-2013 Jun
- Page 204 and 205:
BANCO CREDICOOP COOPERATIVO LIMITAD
- Page 206 and 207:
INFORMACIÓN ADICIONAL Jun-2013 Jun
- Page 208 and 209:
BANCO DE CORRIENTES S.A. EVOLUCIÓN
- Page 210 and 211:
INFORMACIÓN ADICIONAL Dic-2013 Dic
- Page 212 and 213:
BANCO DE FORMOSA S.A. EVOLUCIÓN DE
- Page 214 and 215:
INFORMACIÓN ADICIONAL Dic-2013 Dic
- Page 216 and 217:
BANCO DE GALICIA Y BUENOS AIRES S.A
- Page 218 and 219:
INFORMACIÓN ADICIONAL Dic-2013 Dic
- Page 220 and 221:
BANCO DE INVERSION Y COMERCIO EXTER
- Page 222 and 223:
BANCO DE INVERSION Y COMERCIO EXTER
- Page 224 and 225:
BANCO DE LA CIUDAD DE BUENOS AIRES
- Page 226 and 227:
INFORMACIÓN ADICIONAL Dic-2013 Dic
- Page 228 and 229:
BANCO DE LA NACION ARGENTINA EVOLUC
- Page 230 and 231:
INFORMACIÓN ADICIONAL Dic-2013 Dic
- Page 232 and 233:
BANCO DE LA PAMPA SOCIEDAD DE ECONO
- Page 234 and 235:
BANCO DE LA PAMPA SOCIEDAD DE ECONO
- Page 236 and 237:
BANCO DE LA PROVINCIA DE BUENOS AIR
- Page 238 and 239:
INFORMACIÓN ADICIONAL Dic-2013 Dic
- Page 240 and 241:
BANCO DE LA PROVINCIA DE CORDOBA S.
- Page 242 and 243:
INFORMACIÓN ADICIONAL Dic-2013 Dic
- Page 244 and 245:
BANCO DE LA REPUBLICA ORIENTAL DEL
- Page 246 and 247:
BANCO DE LA REPUBLICA ORIENTAL DEL
- Page 248 and 249:
BANCO DE SAN JUAN S.A. EVOLUCIÓN D
- Page 250 and 251:
INFORMACIÓN ADICIONAL Dic-2013 Dic
- Page 252 and 253:
BANCO DE SANTA CRUZ S.A. EVOLUCIÓN
- Page 254 and 255:
INFORMACIÓN ADICIONAL Dic-2013 Dic
- Page 256 and 257:
BANCO DE SANTIAGO DEL ESTERO S.A. E
- Page 258 and 259:
INFORMACIÓN ADICIONAL Dic-2013 Dic
- Page 260 and 261:
BANCO DE SERVICIOS FINANCIEROS S.A.
- Page 262 and 263:
INFORMACIÓN ADICIONAL Dic-2013 Dic
- Page 264 and 265:
BANCO DE SERVICIOS Y TRANSACCIONES
- Page 266 and 267:
INFORMACIÓN ADICIONAL Dic-2013 Dic
- Page 268 and 269:
BANCO DE VALORES S.A. EVOLUCIÓN DE
- Page 270 and 271:
INFORMACIÓN ADICIONAL Dic-2013 Dic
- Page 272 and 273:
BANCO DEL CHUBUT S.A. EVOLUCIÓN DE
- Page 274 and 275:
INFORMACIÓN ADICIONAL Jun-2013 Jun
- Page 276 and 277:
BANCO DEL SOL S.A. EVOLUCIÓN DE ES
- Page 278 and 279:
INFORMACIÓN ADICIONAL Jun-2013 Jun
- Page 280 and 281:
BANCO DEL TUCUMAN S.A. EVOLUCIÓN D
- Page 282 and 283:
INFORMACIÓN ADICIONAL Dic-2013 Dic
- Page 284 and 285:
BANCO FINANSUR S.A. EVOLUCIÓN DE E
- Page 286 and 287:
INFORMACIÓN ADICIONAL Dic-2013 Dic
- Page 288 and 289:
BANCO HIPOTECARIO S.A. EVOLUCIÓN D
- Page 290 and 291:
INFORMACIÓN ADICIONAL Dic-2013 Dic
- Page 292 and 293:
BANCO INDUSTRIAL S.A. EVOLUCIÓN DE
- Page 294 and 295:
INFORMACIÓN ADICIONAL Dic-2013 Dic
- Page 296 and 297:
BANCO INTERFINANZAS S.A. EVOLUCIÓN
- Page 298 and 299:
INFORMACIÓN ADICIONAL Dic-2013 Dic
- Page 300 and 301:
BANCO ITAU ARGENTINA S.A. EVOLUCIÓ
- Page 302 and 303:
INFORMACIÓN ADICIONAL Dic-2013 Dic
- Page 304 and 305:
BANCO JULIO SOCIEDAD ANONIMA EVOLUC
- Page 306 and 307:
INFORMACIÓN ADICIONAL Jun-2013 Jun
- Page 308 and 309:
BANCO MACRO S.A. EVOLUCIÓN DE ESTA
- Page 310 and 311:
INFORMACIÓN ADICIONAL Dic-2013 Dic
- Page 312 and 313:
BANCO MARIVA S.A. EVOLUCIÓN DE EST
- Page 314 and 315:
INFORMACIÓN ADICIONAL Dic-2013 Dic
- Page 316 and 317:
BANCO MASVENTAS S.A. EVOLUCIÓN DE
- Page 318 and 319:
INFORMACIÓN ADICIONAL Jun-2013 Jun
- Page 320 and 321:
BANCO MERIDIAN S.A. EVOLUCIÓN DE E
- Page 322 and 323:
INFORMACIÓN ADICIONAL Dic-2013 Dic
- Page 324 and 325:
BANCO MUNICIPAL DE ROSARIO EVOLUCI
- Page 326 and 327:
INFORMACIÓN ADICIONAL Dic-2013 Dic
- Page 328 and 329:
BANCO PATAGONIA S.A. EVOLUCIÓN DE
- Page 330 and 331:
INFORMACIÓN ADICIONAL Dic-2013 Dic
- Page 332 and 333:
BANCO PIANO S.A. EVOLUCIÓN DE ESTA
- Page 334 and 335:
INFORMACIÓN ADICIONAL Jun-2013 Jun
- Page 336 and 337:
BANCO PROVINCIA DE TIERRA DEL FUEGO
- Page 338 and 339:
INFORMACIÓN ADICIONAL Dic-2013 Dic
- Page 340 and 341:
BANCO PROVINCIA DEL NEUQUÉN SOCIED
- Page 342 and 343:
BANCO PROVINCIA DEL NEUQUÉN SOCIED
- Page 344 and 345:
BANCO ROELA S.A. EVOLUCIÓN DE ESTA
- Page 346 and 347:
INFORMACIÓN ADICIONAL Dic-2013 Dic
- Page 348 and 349:
BANCO SAENZ S.A. EVOLUCIÓN DE ESTA
- Page 350 and 351:
INFORMACIÓN ADICIONAL Dic-2013 Dic
- Page 352 and 353:
BANCO SANTANDER RIO S.A. EVOLUCIÓN
- Page 354 and 355:
INFORMACIÓN ADICIONAL Dic-2013 Dic
- Page 356 and 357:
BANCO SUPERVIELLE S.A. EVOLUCIÓN D
- Page 358 and 359:
INFORMACIÓN ADICIONAL Dic-2013 Dic
- Page 360 and 361:
BANCO VOII S.A. EVOLUCIÓN DE ESTAD
- Page 362 and 363:
INFORMACIÓN ADICIONAL Dic-2013 Dic
- Page 364 and 365:
BANK OF AMERICA, NATIONAL ASSOCIATI
- Page 366 and 367:
INFORMACIÓN ADICIONAL Dic-2013 Dic
- Page 368 and 369:
BBVA BANCO FRANCES S.A. EVOLUCIÓN
- Page 370 and 371:
INFORMACIÓN ADICIONAL Dic-2013 Dic
- Page 372 and 373:
BNP PARIBAS EVOLUCIÓN DE ESTADOS C
- Page 374 and 375:
INFORMACIÓN ADICIONAL Dic-2013 Dic
- Page 376 and 377:
CAJA DE CREDITO “CUENCA” COOPER
- Page 378 and 379:
CAJA DE CREDITO “CUENCA” COOPER
- Page 380 and 381:
CITIBANK N.A. EVOLUCIÓN DE ESTADOS
- Page 382 and 383:
INFORMACIÓN ADICIONAL Dic-2013 Dic
- Page 384 and 385:
COMPAÑIA FINANCIERA ARGENTINA S.A.
- Page 386 and 387:
INFORMACIÓN ADICIONAL Dic-2013 Dic
- Page 388 and 389:
CORDIAL COMPAÑÍA FINANCIERA S.A.
- Page 390 and 391:
INFORMACIÓN ADICIONAL Dic-2013 Dic
- Page 392 and 393:
DEUTSCHE BANK S.A. EVOLUCIÓN DE ES
- Page 394 and 395:
INFORMACIÓN ADICIONAL Dic-2013 Dic
- Page 396 and 397:
FIAT CREDITO COMPAÑIA FINANCIERA S
- Page 398 and 399:
INFORMACIÓN ADICIONAL Dic-2013 Dic
- Page 400 and 401:
FINANDINO COMPAÑIA FINANCIERA S.A.
- Page 402 and 403:
INFORMACIÓN ADICIONAL Dic-2013 Dic
- Page 404 and 405:
FORD CREDIT COMPAÑIA FINANCIERA S.
- Page 406 and 407:
INFORMACIÓN ADICIONAL Dic-2013 Dic
- Page 408 and 409:
GPAT COMPAÑIA FINANCIERA S.A. EVOL
- Page 410 and 411:
INFORMACIÓN ADICIONAL Dic-2013 Dic
- Page 412 and 413:
HSBC BANK ARGENTINA S.A. EVOLUCIÓN
- Page 414 and 415:
INFORMACIÓN ADICIONAL Jun-2013 Jun
- Page 416 and 417:
INDUSTRIAL AND COMMERCIAL BANK OF C
- Page 418 and 419:
INDUSTRIAL AND COMMERCIAL BANK OF C
- Page 420 and 421:
JOHN DEERE CREDIT COMPAÑÍA FINANC
- Page 422 and 423:
INFORMACIÓN ADICIONAL Dic-2013 Dic
- Page 424 and 425:
JPMORGAN CHASE BANK, NATIONAL ASSOC
- Page 426 and 427:
JPMORGAN CHASE BANK, NATIONAL ASSOC
- Page 428 and 429:
MERCEDES-BENZ COMPAÑÍA FINANCIERA
- Page 430 and 431:
MERCEDES-BENZ COMPAÑÍA FINANCIERA
- Page 432 and 433:
METROPOLIS COMPAÑIA FINANCIERA S.A
- Page 434 and 435:
INFORMACIÓN ADICIONAL Jun-2013 Jun
- Page 436 and 437:
MONTEMAR COMPAÑIA FINANCIERA S.A.
- Page 438 and 439:
INFORMACIÓN ADICIONAL Jun-2013 Jun
- Page 440 and 441:
MULTIFINANZAS COMPAÑIA FINANCIERA
- Page 442 and 443:
INFORMACIÓN ADICIONAL Dic-2013 Dic
- Page 444 and 445:
NUEVO BANCO DE ENTRE RÍOS S.A. EVO
- Page 446 and 447:
INFORMACIÓN ADICIONAL Dic-2013 Dic
- Page 448 and 449:
NUEVO BANCO DE LA RIOJA SOCIEDAD AN
- Page 450 and 451:
INFORMACIÓN ADICIONAL Dic-2013 Dic
- Page 452 and 453:
NUEVO BANCO DE SANTA FE SOCIEDAD AN
- Page 454 and 455:
NUEVO BANCO DE SANTA FE SOCIEDAD AN
- Page 456 and 457:
NUEVO BANCO DEL CHACO S. A. EVOLUCI
- Page 458 and 459:
INFORMACIÓN ADICIONAL Dic-2013 Dic
- Page 460 and 461:
PSA FINANCE ARGENTINA COMPAÑÍA FI
- Page 462 and 463:
PSA FINANCE ARGENTINA COMPAÑÍA FI
- Page 464 and 465:
RCI BANQUE S.A. EVOLUCIÓN DE ESTAD
- Page 466 and 467:
INFORMACIÓN ADICIONAL Dic-2013 Dic
- Page 468 and 469:
ROMBO COMPAÑÍA FINANCIERA S.A. EV
- Page 470 and 471:
INFORMACIÓN ADICIONAL Dic-2013 Dic
- Page 472 and 473:
THE BANK OF TOKYO-MITSUBISHI UFJ, L
- Page 474 and 475:
INFORMACIÓN ADICIONAL Jun-2013 Jun
- Page 476 and 477:
TOYOTA COMPAÑÍA FINANCIERA DE ARG
- Page 478 and 479:
TOYOTA COMPAÑÍA FINANCIERA DE ARG
- Page 480 and 481:
VOLKSWAGEN CREDIT COMPAÑÍA FINANC
- Page 482 and 483:
VOLKSWAGEN CREDIT COMPAÑÍA FINANC
- Page 485:
Reconquista 266 (C1003ABF) Buenos A