

Balanza de Pagos y Estadísticas de la Deuda Externa Primer trimestre de 2016
bal_06_16
bal_06_16

Create successful ePaper yourself
Turn your PDF publications into a flip-book with our unique Google optimized e-Paper software.
2. Cuenta Corriente<br />
2. a Bienes 2<br />
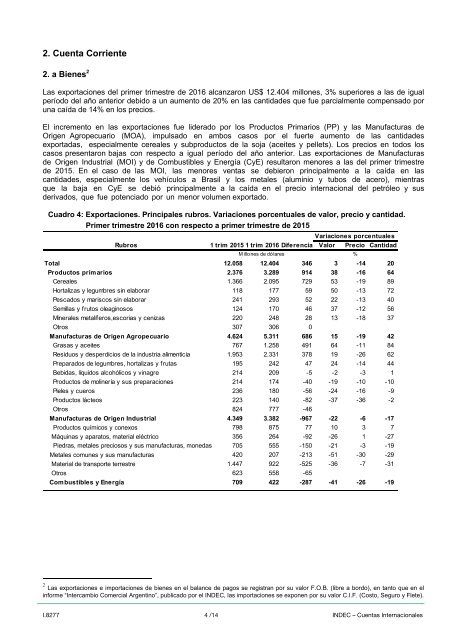
Las exportaciones <strong>de</strong>l primer <strong>trimestre</strong> <strong>de</strong> <strong>2016</strong> alcanzaron US$ 12.404 millones, 3% superiores a <strong>la</strong>s <strong>de</strong> igual<br />
período <strong>de</strong>l año anterior <strong>de</strong>bido a un aumento <strong>de</strong> 20% en <strong>la</strong>s cantida<strong>de</strong>s que fue parcialmente compensado por<br />
una caída <strong>de</strong> 14% en los precios.<br />
El incremento en <strong>la</strong>s exportaciones fue li<strong>de</strong>rado por los Productos Primarios (PP) y <strong>la</strong>s Manufacturas <strong>de</strong><br />
Origen Agropecuario (MOA), impulsado en ambos casos por el fuerte aumento <strong>de</strong> <strong>la</strong>s cantida<strong>de</strong>s<br />
exportadas, especialmente cereales y subproductos <strong>de</strong> <strong>la</strong> soja (aceites y pellets). Los precios en todos los<br />
casos presentaron bajas con respecto a igual período <strong>de</strong>l año anterior. Las exportaciones <strong>de</strong> Manufacturas<br />
<strong>de</strong> Origen Industrial (MOI) y <strong>de</strong> Combustibles y Energía (CyE) resultaron menores a <strong>la</strong>s <strong>de</strong>l primer <strong>trimestre</strong><br />
<strong>de</strong> 2015. En el caso <strong>de</strong> <strong>la</strong>s MOI, <strong>la</strong>s menores ventas se <strong>de</strong>bieron principalmente a <strong>la</strong> caída en <strong>la</strong>s<br />
cantida<strong>de</strong>s, especialmente los vehículos a Brasil y los metales (aluminio y tubos <strong>de</strong> acero), mientras<br />
que <strong>la</strong> baja en CyE se <strong>de</strong>bió principalmente a <strong>la</strong> caída en el precio internacional <strong>de</strong>l petróleo y sus<br />
<strong>de</strong>rivados, que fue potenciado por un menor volumen exportado.<br />
Cuadro 4: Exportaciones. Principales rubros. Variaciones porcentuales <strong>de</strong> valor, precio y cantidad.<br />
<strong>Primer</strong> <strong>trimestre</strong> <strong>2016</strong> con respecto a primer <strong>trimestre</strong> <strong>de</strong> 2015<br />
Variaciones porcentuales<br />
Rubros 1 trim 2015 1 trim <strong>2016</strong> Diferencia Valor Precio Cantidad<br />
M illones <strong>de</strong> dó<strong>la</strong>res %<br />
Total 12.058 12.404 346 3 -14 20<br />
Productos primarios 2.376 3.289 914 38 -16 64<br />
Cereales 1.366 2.095 729 53 -19 89<br />
Hortalizas y legumbres sin e<strong>la</strong>borar 118 177 59 50 -13 72<br />
Pescados y mariscos sin e<strong>la</strong>borar 241 293 52 22 -13 40<br />
Semil<strong>la</strong>s y frutos oleaginosos 124 170 46 37 -12 56<br />
Minerales metalíferos,escorias y cenizas 220 248 28 13 -18 37<br />
Otros 307 306 0<br />
Manufacturas <strong>de</strong> Origen Agropecuario 4.624 5.311 686 15 -19 42<br />
Grasas y aceites 767 1.258 491 64 -11 84<br />
Residuos y <strong>de</strong>sperdicios <strong>de</strong> <strong>la</strong> industria alimenticia 1.953 2.331 378 19 -26 62<br />
Preparados <strong>de</strong> legumbres, hortalizas y frutas 195 242 47 24 -14 44<br />
Bebidas, líquidos alcohólicos y vinagre 214 209 -5 -2 -3 1<br />
Productos <strong>de</strong> molinería y sus preparaciones 214 174 -40 -19 -10 -10<br />
Pieles y cueros 236 180 -56 -24 -16 -9<br />
Productos lácteos 223 140 -82 -37 -36 -2<br />
Otros 824 777 -46<br />
Manufacturas <strong>de</strong> Origen Industrial 4.349 3.382 -967 -22 -6 -17<br />
Productos químicos y conexos<br />
Máquinas y aparatos, material eléctrico<br />
Piedras, metales preciosos y sus manufacturas, monedas<br />
798 875 77 10 3 7<br />
356 264 -92 -26 1 -27<br />
705 555 -150 -21 -3 -19<br />
420 207 -213 -51 -30 -29<br />
1.447 922 -525 -36 -7 -31<br />
Metales comunes y sus manufacturas<br />
Material <strong>de</strong> transporte terrestre<br />
Otros 623 558 -65<br />
Combustibles y Energía 709 422 -287 -41 -26 -19<br />
2 Las exportaciones e importaciones <strong>de</strong> bienes en el ba<strong>la</strong>nce <strong>de</strong> pagos se registran por su valor F.O.B. (libre a bordo), en tanto que en el<br />
informe “Intercambio Comercial Argentino”, publicado por el INDEC, <strong>la</strong>s importaciones se exponen por su valor C.I.F. (Costo, Seguro y Flete).<br />
I.8277 4 /14 INDEC – Cuentas Internacionales