You also want an ePaper? Increase the reach of your titles
YUMPU automatically turns print PDFs into web optimized ePapers that Google loves.
Práctica 18<br />
CF<br />
m<br />
=<br />
∑<br />
k<br />
1<br />
CFt<br />
K<br />
=<br />
∑<br />
k<br />
C<br />
−<br />
K<br />
∑<br />
k<br />
1 t 1<br />
Pt<br />
El riesgo está en que los valores X e Y no sean<br />
“verdaderos”; la cuantificación de ese riesgo viene dada por el<br />
valor de las desviaciones sobre el valor medio CFm. Este valor se<br />
llama varianza estadística (σ 2 ):<br />
σ<br />
K= Número de periodos.<br />
∑<br />
2<br />
2<br />
( CFt<br />
− CF<br />
2 1<br />
m<br />
)<br />
=<br />
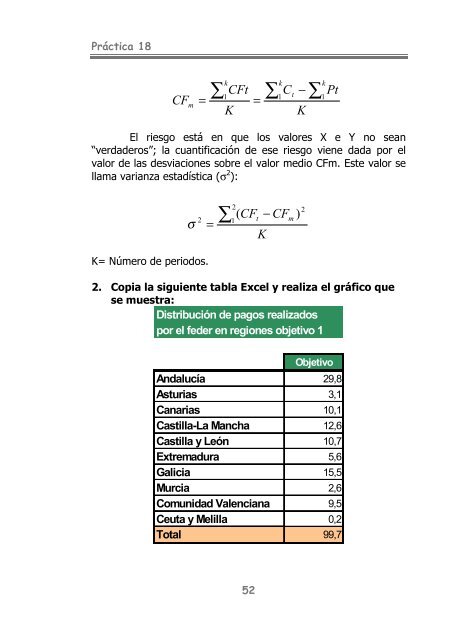
2. Copia la siguiente tabla Excel y realiza el gráfico que<br />
se muestra:<br />
Distribución de pagos realizados<br />
por el feder en regiones objetivo 1<br />
K<br />
Objetivo<br />
Andalucía 29,8<br />
Asturias 3,1<br />
Canarias 10,1<br />
Castilla-La Mancha 12,6<br />
Castilla y León 10,7<br />
Extremadura 5,6<br />
Galicia 15,5<br />
Murcia 2,6<br />
Comunidad Valenciana 9,5<br />
Ceuta y Melilla 0,2<br />
Total 99,7<br />
52


