Patrones de mortalidad en España 2014
PatronesMortalidadEspana2014.1
PatronesMortalidadEspana2014.1

Create successful ePaper yourself
Turn your PDF publications into a flip-book with our unique Google optimized e-Paper software.
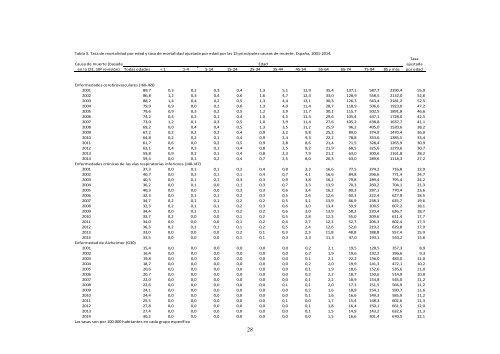
Tabla 3. Tasa <strong>de</strong> <strong>mortalidad</strong> por edad y tasa <strong>de</strong> <strong>mortalidad</strong> ajustada por edad por las 15 principales causas <strong>de</strong> muerte. <strong>España</strong>, 2001-<strong>2014</strong>.<br />
Causa <strong>de</strong> muerte (basada<br />
<strong>en</strong> la CIE, 10ª revisión)<br />
Edad<br />
Todas eda<strong>de</strong>s < 1 1-4 5-14 15-24 25-34 35-44 45-54 55-64 65-74 75-84 85 y más<br />
Tasa<br />
ajustada<br />
por edad<br />
Enfermeda<strong>de</strong>s cerebrovasculares (I60-I69)<br />
2001 89,7 0,3 0,2 0,3 0,4 1,3 5,1 12,9 35,4 137,1 587,7 2190,4 55,0<br />
2002 86,8 1,2 0,3 0,4 0,6 1,6 4,7 12,4 33,0 128,9 558,5 2132,0 52,6<br />
2003 88,2 1,4 0,4 0,2 0,5 1,3 4,4 13,1 30,3 126,3 563,4 2181,2 52,5<br />
2004 79,9 0,9 0,0 0,2 0,6 1,3 4,0 11,4 28,7 118,9 506,6 1923,0 47,2<br />
2005 79,6 0,9 0,3 0,2 0,5 1,2 3,9 11,7 30,1 115,7 502,5 1891,8 46,6<br />
2006 74,2 0,4 0,2 0,1 0,4 1,0 4,5 11,3 29,6 105,4 447,1 1728,0 42,5<br />
2007 73,0 1,2 0,1 0,3 0,5 1,0 3,9 11,4 27,6 105,2 438,8 1637,7 41,1<br />
2008 69,2 0,0 0,4 0,4 0,5 1,3 3,5 11,2 25,9 96,2 405,0 1520,6 38,2<br />
2009 67,2 0,2 0,2 0,2 0,4 0,9 3,2 9,8 25,2 89,0 374,9 1470,4 36,0<br />
2010 64,8 0,2 0,2 0,1 0,4 0,9 2,4 9,3 22,2 78,8 353,6 1385,5 33,4<br />
2011 61,7 0,6 0,0 0,2 0,5 0,9 2,8 8,6 21,4 71,5 328,4 1265,9 30,9<br />
2012 63,1 0,4 0,3 0,1 0,4 0,8 2,5 8,2 21,9 68,5 325,6 1279,6 30,7<br />
2013 59,8 0,9 0,2 0,1 0,4 0,8 2,3 7,9 21,2 63,0 300,6 1161,8 28,2<br />
<strong>2014</strong> 59,4 0,0 0,1 0,2 0,4 0,7 2,5 8,0 20,3 63,0 289,6 1118,3 27,2<br />
Enfermeda<strong>de</strong>s crónicas <strong>de</strong> las vías respiratorias inferiores (J40-J47)<br />
2001 37,3 0,0 0,1 0,1 0,2 0,4 0,8 3,3 16,6 77,5 274,2 716,8 22,9<br />
2002 40,7 0,0 0,2 0,1 0,1 0,4 0,7 4,1 16,6 84,8 296,6 771,4 24,7<br />
2003 40,5 0,0 0,1 0,1 0,3 0,3 0,9 3,8 16,2 79,8 289,4 795,4 24,2<br />
2004 36,2 0,0 0,1 0,0 0,1 0,3 0,7 3,3 13,9 70,3 260,2 704,1 21,3<br />
2005 40,3 0,0 0,0 0,0 0,3 0,3 0,6 3,4 16,2 80,3 287,1 770,4 23,6<br />
2006 32,3 0,0 0,1 0,1 0,2 0,3 0,5 2,6 12,6 60,3 222,4 627,0 18,5<br />
2007 34,7 0,2 0,1 0,1 0,2 0,2 0,5 3,1 13,9 66,9 238,3 635,7 19,6<br />
2008 32,3 0,2 0,1 0,1 0,2 0,3 0,6 3,0 13,4 59,9 209,5 607,2 18,1<br />
2009 34,4 0,0 0,1 0,1 0,2 0,2 0,6 3,0 13,9 58,2 220,4 636,7 18,7<br />
2010 33,7 0,2 0,0 0,0 0,1 0,2 0,5 2,8 12,3 55,0 209,6 611,4 17,7<br />
2011 34,0 0,0 0,0 0,0 0,1 0,2 0,4 2,7 12,3 52,7 206,3 602,4 17,3<br />
2012 36,3 0,2 0,1 0,1 0,1 0,2 0,5 2,4 12,6 52,0 219,2 629,8 17,9<br />
2013 33,0 0,0 0,0 0,0 0,2 0,1 0,3 2,3 11,8 48,8 188,8 557,4 15,9<br />
<strong>2014</strong> 33,5 0,0 0,0 0,0 0,1 0,1 0,3 2,3 11,3 47,0 193,1 543,2 15,6<br />
Enfermedad <strong>de</strong> Alzheimer (G30)<br />
2001 15,4 0,0 0,0 0,0 0,0 0,0 0,0 0,2 2,1 19,5 128,5 357,3 8,9<br />
2002 16,4 0,0 0,0 0,0 0,0 0,0 0,0 0,2 1,9 19,6 132,2 396,6 9,3<br />
2003 19,8 0,0 0,0 0,0 0,0 0,0 0,0 0,1 2,1 22,2 156,0 483,0 11,0<br />
2004 18,7 0,0 0,0 0,0 0,0 0,0 0,0 0,2 2,0 19,9 141,3 472,1 10,2<br />
2005 20,6 0,0 0,0 0,0 0,0 0,0 0,0 0,1 1,9 18,6 152,6 535,6 11,0<br />
2006 20,7 0,0 0,0 0,0 0,0 0,0 0,0 0,2 2,2 18,7 150,6 514,9 10,8<br />
2007 22,0 0,0 0,0 0,0 0,0 0,0 0,0 0,1 2,2 18,9 154,8 545,0 11,2<br />
2008 22,6 0,0 0,0 0,0 0,0 0,0 0,1 0,1 2,0 17,3 151,5 566,9 11,2<br />
2009 24,1 0,0 0,0 0,0 0,0 0,0 0,0 0,2 1,6 18,9 154,1 590,7 11,6<br />
2010 24,4 0,0 0,0 0,0 0,0 0,0 0,0 0,1 1,6 16,6 149,3 585,9 11,2<br />
2011 25,5 0,0 0,0 0,0 0,0 0,0 0,1 0,0 1,7 15,4 148,3 602,6 11,3<br />
2012 27,8 0,0 0,0 0,0 0,0 0,0 0,0 0,1 1,8 16,4 150,1 661,5 12,0<br />
2013 27,4 0,0 0,0 0,0 0,0 0,0 0,0 0,1 1,5 14,9 143,2 632,6 11,3<br />
<strong>2014</strong> 30,2 0,0 0,0 0,0 0,0 0,0 0,0 0,0 1,5 16,6 301,4 670,5 12,1<br />
Las tasas son por 100.000 habitantes <strong>en</strong> cada grupo específico<br />
28