Anuario CE CAS 2017 Versión 3

You also want an ePaper? Increase the reach of your titles
YUMPU automatically turns print PDFs into web optimized ePapers that Google loves.
Estados Unidos 37 36 30 17 28 -6,9% 61,1% 4,7%<br />
Uruguay 34 25 11 14 21 -11,2% 58,2% 3,4%<br />
Holanda 4 8 8 11 17 44,2% 59,3% 1,5%<br />
India 6 16 11 7 11 13,9% 46,0% 1,6%<br />
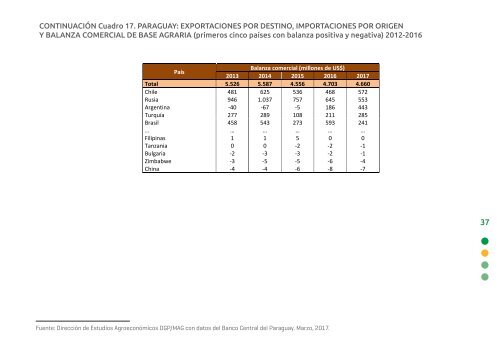
CONTINUACIÓN Cuadro 17. PARAGUAY: EXPORTACIONES POR DESTINO, IMPORTACIONES POR ORIGEN<br />
Y BALANZA COMERCIAL DE BASE AGRARIA (primeros cinco países con balanza positiva y negativa) 2012-2016<br />
México 2 5 8 7 10 46,3% 44,2% 1,0%<br />
China 5 5 6 8 7 8,2% -11,9% 1,0%<br />
Grecia 3 8 7 5 6 17,0% 18,9% 0,9%<br />
Otros 41 43 37 36 38 -1,8% 5,0% 6,2%<br />
País<br />
Balanza comercial (millones de US$)<br />
2013 2014 2015 2016 <strong>2017</strong><br />
Total 5.526 5.587 4.556 4.703 4.660<br />
Chile 481 625 536 468 572<br />
Rusia 946 1.037 757 645 553<br />
Argentina -40 -67 -5 186 443<br />
Turquía 277 289 108 211 285<br />
Brasil 458 543 273 593 241<br />
… … … … … …<br />
Filipinas 1 1 5 0 0<br />
Tanzania 0 0 -2 -2 -1<br />
Bulgaria -2 -3 -3 -2 -1<br />
Zimbabwe -3 -5 -5 -6 -4<br />
China -4 -4 -6 -8 -7<br />
Fuente: Dirección de Estudios Agroeconómicos/DGP/MAG con datos del Banco Central del<br />
Paraguay.<br />
26<br />
37<br />
Fuente: Dirección de Estudios Agroeconómicos DGP/MAG con datos del Banco Central del Paraguay. Marzo, <strong>2017</strong>.