Anuario CAS 2017 FINAL

Create successful ePaper yourself
Turn your PDF publications into a flip-book with our unique Google optimized e-Paper software.
Cuadro 23. PARAGUAY: BALANZA COMERCIAL DE BASE AGRARIA CON<br />
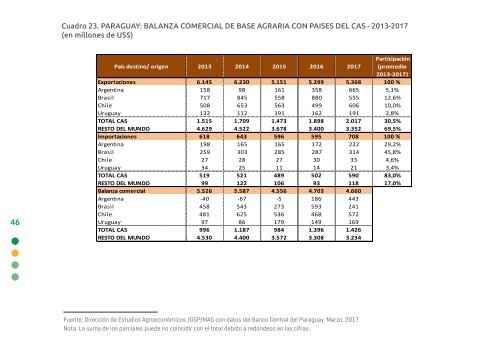
Cuadro 23. PARAGUAY: BALANZA COMERCIAL DE BASE AGRARIA CON PAISES DEL <strong>CAS</strong> - 2013-<strong>2017</strong><br />
(en millones PAISES de US$) DEL <strong>CAS</strong> - 2013 - <strong>2017</strong> (en millones de US$)<br />
46<br />
País destino/ origen 2013 2014 2015 2016 <strong>2017</strong><br />
Participación<br />
(promedio<br />
2013-<strong>2017</strong>)<br />
Exportaciones 6.145 6.230 5.151 5.299 5.368 100 %<br />
Argentina 158 98 161 358 665 5,1%<br />
Brasil 717 845 558 880 555 12,6%<br />
Chile 508 653 563 499 606 10,0%<br />
Uruguay 132 112 191 162 191 2,8%<br />
TOTAL <strong>CAS</strong> 1.515 1.709 1.473 1.898 2.017 30,5%<br />
RESTO DEL MUNDO 4.629 4.522 3.678 3.400 3.352 69,5%<br />
Importaciones 618 643 596 595 708 100 %<br />
Argentina 198 165 165 172 222 29,2%<br />
Brasil 259 303 285 287 314 45,8%<br />
Chile 27 28 27 30 33 4,6%<br />
Uruguay 34 25 11 14 21 3,4%<br />
TOTAL <strong>CAS</strong> 519 521 489 502 590 83,0%<br />
RESTO DEL MUNDO 99 122 106 93 118 17,0%<br />
Balanza comercial 5.526 5.587 4.556 4.703 4.660<br />
Argentina -40 -67 -5 186 443<br />
Brasil 458 543 273 593 241<br />
Chile 481 625 536 468 572<br />
Uruguay 97 86 179 149 169<br />
TOTAL <strong>CAS</strong> 996 1.187 984 1.396 1.426<br />
RESTO DEL MUNDO 4.530 4.400 3.572 3.308 3.234<br />
Fuente: Dirección de Estudios Agroeconómicos/DGP/MAG con datos del Banco Central del Paraguay.<br />
Nota: La suma de los parciales puede no coincidir con el total debido a redondeos en las cifras.<br />
Fuente: Dirección de Estudios Agroeconómicos /DGP/MAG con datos del Banco Central del Paraguay. Marzo, <strong>2017</strong>.<br />
Nota: La suma de los parciales puede no coincidir con el total debido a redondeos en las cifras.