Kaarsberg Summer Autumn 2022

Create successful ePaper yourself
Turn your PDF publications into a flip-book with our unique Google optimized e-Paper software.
PAG 02 a 11 ADS 54.qxp_Layout 1 19/7/22 20:43 Página 6<br />
LOCAL MARKETS<br />
LOCAL MARKETS<br />
Q2 <strong>2022</strong> REPORT<br />
More obvious was the decrease in the distance between the highest prices registered in the previous cycle. The regions leading this<br />
decrease were the Balearics, 5.2% below its highest prices on record, followed by Madrid, 14% below. Prices in the autonomous cities of Ceuta<br />
and Melilla remained close to their highest, at 8.6% and 6.8% below them, respectively. In a total of 7 out of 19 regions prices were still 30%<br />
below their highest.<br />
Provinces<br />
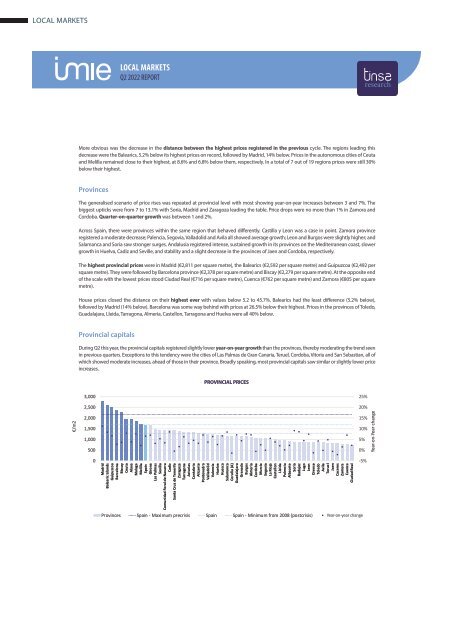
The generalised scenario of price rises was repeated at provincial level with most showing year-on-year increases between 3 and 7%. The<br />
biggest upticks were from 7 to 13.1% with Soria, Madrid and Zaragoza leading the table. Price drops were no more than 1% in Zamora and<br />
Cordoba. Quarter-on-quarter growth was between 1 and 2%.<br />
Across Spain, there were provinces within the same region that behaved differently. Castilla y Leon was a case in point. Zamora province<br />
registered a moderate decrease; Palencia, Segovia, Valladolid and Avila all showed average growth; Leon and Burgos were slightly higher; and<br />
Salamanca and Soria saw stronger surges. Andalusia registered intense, sustained growth in its provinces on the Mediterranean coast, slower<br />
growth in Huelva, Cadiz and Seville, and stability and a slight decrease in the provinces of Jaen and Cordoba, respectively.<br />
The highest provincial prices were in Madrid (€2,811 per square metre), the Balearics (€2,592 per square metre) and Guipuzcoa (€2,492 per<br />
square metre). They were followed by Barcelona province (€2,378 per square metre) and Biscay (€2,279 per square metre). At the opposite end<br />
of the scale with the lowest prices stood Ciudad Real (€716 per square metre), Cuenca (€762 per square metre) and Zamora (€805 per square<br />
metre).<br />
House prices closed the distance on their highest ever with values below 5.2 to 45.7%. Balearics had the least difference (5.2% below),<br />
followed by Madrid (14% below). Barcelona was some way behind with prices at 26.5% below their highest. Prices in the provinces of Toledo,<br />
Guadalajara, Lleida, Tarragona, Almeria, Castellon, Tarragona and Huelva were all 40% below.<br />
Provincial capitals<br />
During Q2 this year, the provincial capitals registered slightly lower year-on-year growth than the provinces, thereby moderating the trend seen<br />
in previous quarters. Exceptions to this tendency were the cities of Las Palmas de Gran Canaria, Teruel, Cordoba, Vitoria and San Sebastian, all of<br />
which showed moderate increases, ahead of those in their province. Broadly speaking, most provincial capitals saw similar or slightly lower price<br />
increases.<br />
PROVINCIAL PRICES<br />
€/m2<br />
3,000<br />
2,500<br />
2,000<br />
1,500<br />
1,000<br />
500<br />
0<br />
Madrid<br />
Balearic Islands<br />
Guipuzcoa<br />
Barcelona<br />
Biscay<br />
Ceuta<br />
Alava<br />
Malaga<br />
Melilla<br />
Spain<br />
Girona<br />
Las Palmas<br />
Sevilla<br />
Comunidad Foral de Navarra<br />
Cadiz<br />
Santa Cruz de Tenerife<br />
Zaragoza<br />
Tarragona<br />
Asturias<br />
Cantabria<br />
Alicante<br />
Pontevedra<br />
Valladolid<br />
Valencia<br />
Huelva<br />
Huesca<br />
Salamanca<br />
Coruña (A)<br />
Guadalajara<br />
Granada<br />
Burgos<br />
Almeria<br />
Cordoba<br />
Murcia<br />
Segovia<br />
La Rioja<br />
Castellon<br />
Lleida<br />
Palencia<br />
Albacete<br />
Soria<br />
Badajoz<br />
Lugo<br />
Leon<br />
Orense<br />
Toledo<br />
Avila<br />
Teruel<br />
Jaen<br />
Caceres<br />
Zamora<br />
Cuenca<br />
Ciudad Real<br />
25%<br />
20%<br />
15%<br />
10%<br />
5%<br />
0%<br />
-5%<br />
Year-on-Year change<br />
Provinces Spain - Maximum precrisis Spain Spain - Minimum from 2008 (postcrisis Year-on-year Var. Interanual change