Profil d'eau de baignade du Lac de Weiswampach - Administration ...
Profil d'eau de baignade du Lac de Weiswampach - Administration ...
Profil d'eau de baignade du Lac de Weiswampach - Administration ...

You also want an ePaper? Increase the reach of your titles
YUMPU automatically turns print PDFs into web optimized ePapers that Google loves.
o-Phosphates (µg/l)/phosphore total (µg/l)<br />
140<br />
120<br />
100<br />
80<br />
60<br />
40<br />
20<br />
0<br />
27.04.2005<br />
28.04.2005<br />
02.06.2005<br />
29.06.2005<br />
27.07.2005<br />
04.08.2005<br />
23.08.2005<br />
25.08.2005<br />
26.04.2006<br />
01.06.2006<br />
28.06.2006<br />
26.07.2006<br />
24.08.2006<br />
25.04.2007<br />
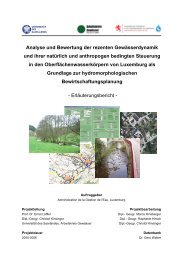
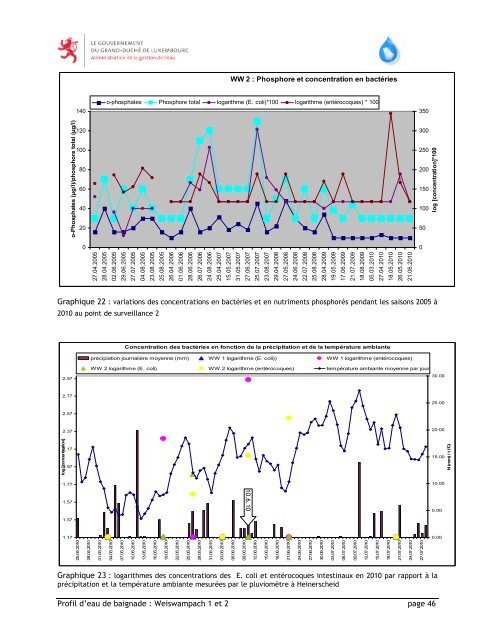
WW 2 : Phosphore et concentration en bactéries<br />
o-phosphates Phosphore total logarithme (E. coli)*100 logarithme (entérocoques) * 100<br />
15.05.2007<br />
31.05.2007<br />
27.06.2007<br />
25.07.2007<br />
Graphique 22 : variations <strong>de</strong>s concentrations en bactéries et en nutriments phosphorés pendant les saisons 2005 à<br />
2010 au point <strong>de</strong> surveillance 2<br />
log [concentration]<br />
2.97<br />
2.77<br />
2.57<br />
2.37<br />
2.17<br />
1.97<br />
1.77<br />
1.57<br />
1.37<br />
1.17<br />
25.04.2010<br />
28.04.2010<br />
<strong>Profil</strong> d’eau <strong>de</strong> baigna<strong>de</strong> : <strong>Weiswampach</strong> 1 et 2 page 46<br />
23.08.2007<br />
29.04.2008<br />
27.05.2008<br />
24.06.2008<br />
22.07.2008<br />
25.08.2008<br />
28.04.2009<br />
19.05.2009<br />
17.06.2009<br />
21.07.2009<br />
18.08.2009<br />
05.03.2010<br />
27.04.2010<br />
18.05.2010<br />
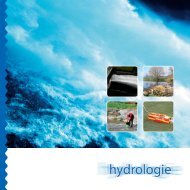
Concentration <strong>de</strong>s bactéries en fonction <strong>de</strong> la précipitation et <strong>de</strong> la température ambiante<br />
26.05.2010<br />
21.06.2010<br />
précipiation journalière moyenne (mm) WW 1 logarithme (E. coli)) WW 1 logarithme (entérocoques)<br />
WW 2 logarithme (E. coli) WW 2 logarithme (entérocoques) température ambiante moyenne par jour<br />
01.05.2010<br />
04.05.2010<br />
07.05.2010<br />
10.05.2010<br />
13.05.2010<br />
16.05.2010<br />
19.05.2010<br />
22.05.2010<br />
25.05.2010<br />
28.05.2010<br />
31.05.2010<br />
03.06.2010<br />
06.06.2010<br />
09.06.2010<br />
10.6.10<br />
Graphique 23 : logarithmes <strong>de</strong>s concentrations <strong>de</strong>s E. coli et entérocoques intestinaux en 2010 par rapport à la<br />
précipitation et la température ambiante mesurées par le pluviomètre à Heinerscheid<br />
12.06.2010<br />
15.06.2010<br />
18.06.2010<br />
21.06.2010<br />
24.06.2010<br />
27.06.2010<br />
30.06.2010<br />
03.07.2010<br />
06.07.2010<br />
09.07.2010<br />
12.07.2010<br />
15.07.2010<br />
18.07.2010<br />
21.07.2010<br />
24.07.2010<br />
350<br />
300<br />
250<br />
200<br />
150<br />
100<br />
50<br />
0<br />
27.07.2010<br />
log [concentration]*100<br />
30.00<br />
25.00<br />
20.00<br />
15.00<br />
10.00<br />
5.00<br />
0.00<br />
N (mm) / t (°C)