Montero <strong>et</strong> al., 2003. Antropo, 4, 35-44. www.didac.ehu.es/antropo AGE MOYENNE DEV. STAND. PERC. 10 PERC. 25 PERC. 50 PERC. 75 PERC. 90 11 17,7 2,4 14,6 16,0 17,7 19,3 20,8 ANNÉES 12 18,0 2,5 15,0 16,5 18,2 19,9 21,5 ANNÉES 13 18,8 2,7 15,3 17,0 18,8 20,6 22,2 ANNÉES 14 19,4 2,7 16,0 17,6 19,4 21,2 22,8 ANNÉES 15 20,4 2,8 16,8 18,5 20,4 22,3 24,0 ANNÉES 16 21,2 3,1 17,4 19,3 21,4 23,5 25,4 ANNÉES 17 22,1 3,3 17,9 19,9 22,1 24,3 26,4 ANNEÉS 18 21,9 2,8 18,3 19,9 21,9 23,7 25,4 ANNÉES Table 1a. Valeurs <strong>de</strong> IMC <strong>chez</strong> <strong>les</strong> garçons. Adapté <strong>de</strong> Hernán<strong>de</strong>z <strong>et</strong> Sán<strong>chez</strong> (1999). Table 1a. BMI values in spanish boys. Adapted from Hernán<strong>de</strong>z <strong>et</strong> Sán<strong>chez</strong> (1999). AGE MOYENNE DEV. STAND. PERC. 10 PERC. 25 PERC. 50 PERC. 75 PERC. 90 11 18,2 2,6 14,8 16,4 18,2 19,9 21,6 ANNÉES 12 18,7 2,7 15,2 16,9 18,7 20,5 22,0 ANNÉES 13 19,4 2,9 15,7 17,4 19,4 21,3 23,0 ANNÉES 14 20,4 2,8 16,8 18,5 20,4 22,3 24,0 ANNÉES 15 20,8 2,8 17,3 18,9 20,8 22,7 24,3 ANNÉES 16 20,8 2,5 17,6 19,1 20,8 22,5 24,0 ANNÉES 17 20,9 2,2 18,0 19,5 20,9 22,4 23,7 ANNEÉS 18 20,6 2,1 17,9 19,2 20,6 22,0 23,3 ANNÉES Table 1b. Valeurs <strong>de</strong> IMC <strong>chez</strong> <strong>les</strong> fil<strong>les</strong>. Adapté <strong>de</strong> Hernán<strong>de</strong>z <strong>et</strong> Sán<strong>chez</strong> (1999). Table 1b. BMI values in spanish girls. Adapted from Hernán<strong>de</strong>z <strong>et</strong> Sán<strong>chez</strong> (1999). Résultats Les valeurs moyennes d’Indice <strong>de</strong> Masse Corporelle (IMC) sont assez elevées pour tous <strong>les</strong> groupes d’âge <strong>et</strong> pour <strong>les</strong> <strong>de</strong>ux sexes (Table 2). Environ le 16% (N=20) <strong>de</strong> l’échantillon présentent <strong>de</strong>s valeurs <strong>de</strong> IMC au-<strong>de</strong>ssous <strong>de</strong> cel<strong>les</strong> correspondant au poids normal, le 51% (N=152) ont un poids normal, 19% (N=56) ont <strong>de</strong>s valeurs correspondant à un surpoids <strong>et</strong> le 24% (N=71) restant sont obèses. Il n’y a pas <strong>de</strong> différences statistiquement significatives entre garçons <strong>et</strong> fil<strong>les</strong> par group d’âge. (Table 3). Le <strong>de</strong>gré <strong>de</strong> satisfaction avec son image <strong>corporelle</strong> est différent selon le sexe: 15% <strong>de</strong>s fil<strong>les</strong> voudraient peser plus contre 28% <strong>de</strong>s garçons, 65% <strong>de</strong>s fil<strong>les</strong> voudraient perdre du poids contre 38% <strong>de</strong>s garçons <strong>et</strong> 20% <strong>de</strong>s fil<strong>les</strong> sont satisfaites <strong>de</strong> leur poids face à 34% <strong>de</strong>s garçons (χ 2 =15.55, dl=3, p=.001). 38
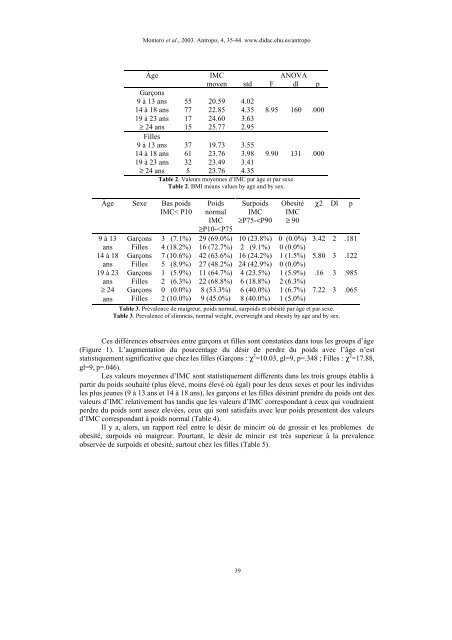
Montero <strong>et</strong> al., 2003. Antropo, 4, 35-44. www.didac.ehu.es/antropo Àge IMC ANOVA moyen std F dl p Garçons 9 à 13 ans 55 20.59 4.02 14 à 18 ans 77 22.85 4.35 8.95 160 .000 19 à 23 ans 17 24.60 3.63 ≥ 24 ans 15 25.77 2.95 Fil<strong>les</strong> 9 à 13 ans 37 19.73 3.55 14 à 18 ans 61 23.76 3.98 9.90 131 .000 19 à 23 ans 32 23.49 3.41 ≥ 24 ans 5 23.76 4.35 Table 2. Valeurs moyennes d’IMC par àge <strong>et</strong> par sexe. Table 2. BMI means values by age and by sex. Àge Sexe Bas poids IMC< P10 Poids normal IMC ≥P10-