Rapport annuel 2012 - pour impression - Pointe-à-Callière
Rapport annuel 2012 - pour impression - Pointe-à-Callière
Rapport annuel 2012 - pour impression - Pointe-à-Callière

Create successful ePaper yourself
Turn your PDF publications into a flip-book with our unique Google optimized e-Paper software.
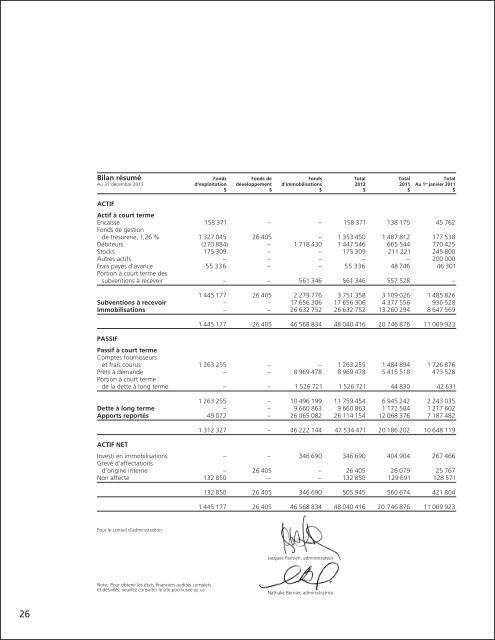
Bilan résumé Fonds Fonds de Fonds Total Total Total<br />
Au 31 décembre <strong>2012</strong> d’exploitation développement d’immobilisations <strong>2012</strong> 2011 Au 1 er janvier 2011<br />
$ $ $ $ $ $<br />
Actif<br />
Actif <strong>à</strong> court terme<br />
Encaisse 158 371 – – 158 371 138 175 45 762<br />
Fonds de gestion<br />
de trésorerie, 1,26 % 1 327 045 26 405 – 1 353 450 1 487 812 177 538<br />
Débiteurs (270 884) – 1 718 430 1 447 546 665 544 770 425<br />
Stocks 175 309 – – 175 309 211 221 245 800<br />
Autres actifs – – – – – 200 000<br />
Frais payés d’avance 55 336 – – 55 336 48 746 46 301<br />
Portion <strong>à</strong> court terme des<br />
subventions <strong>à</strong> recevoir – – 561 346 561 346 557 528 –<br />
1 445 177 26 405 2 279 776 3 751 358 3 109 026 1 485 826<br />
Subventions <strong>à</strong> recevoir – – 17 656 306 17 656 306 4 377 556 936 528<br />
Immobilisations – – 26 632 752 26 632 752 13 260 294 8 647 569<br />
1 445 177 26 405 46 568 834 48 040 416 20 746 876 11 069 923<br />
Passif<br />
Passif <strong>à</strong> court terme<br />
Comptes fournisseurs<br />
et frais courus 1 263 255 – – 1 263 255 1 484 894 1 726 876<br />
Prêts <strong>à</strong> demande – – 8 969 478 8 969 478 5 415 518 473 528<br />
Portion <strong>à</strong> court terme<br />
de la dette <strong>à</strong> long terme – – 1 526 721 1 526 721 44 830 42 631<br />
1 263 255 – 10 496 199 11 759 454 6 945 242 2 243 035<br />
Dette <strong>à</strong> long terme – – 9 660 863 9 660 863 1 172 584 1 217 602<br />
Apports reportés 49 072 – 26 065 082 26 114 154 12 068 376 7 187 482<br />
1 312 327 – 46 222 144 47 534 471 20 186 202 10 648 119<br />
Actif net<br />
Investi en immobilisations – – 346 690 346 690 404 904 267 466<br />
Grevé d’affectations<br />
d’origine interne – 26 405 – 26 405 26 079 25 767<br />
Non affecté 132 850 – – 132 850 129 691 128 571<br />
132 850 26 405 346 690 505 945 560 674 421 804<br />
1 445 177 26 405 46 568 834 48 040 416 20 746 876 11 069 923<br />
Pour le conseil d’administration<br />
Jacques Parisien, administrateur<br />
Note : Pour obtenir les états financiers audités complets<br />
et détaillés, veuillez consulter le site pacmusee.qc.ca<br />
Nathalie Bernier, administratrice<br />
26