Habitat en Chiffres 2008-2010 - Ministère de l'Habitat, de l ...
Habitat en Chiffres 2008-2010 - Ministère de l'Habitat, de l ...
Habitat en Chiffres 2008-2010 - Ministère de l'Habitat, de l ...
- No tags were found...

Create successful ePaper yourself
Turn your PDF publications into a flip-book with our unique Google optimized e-Paper software.
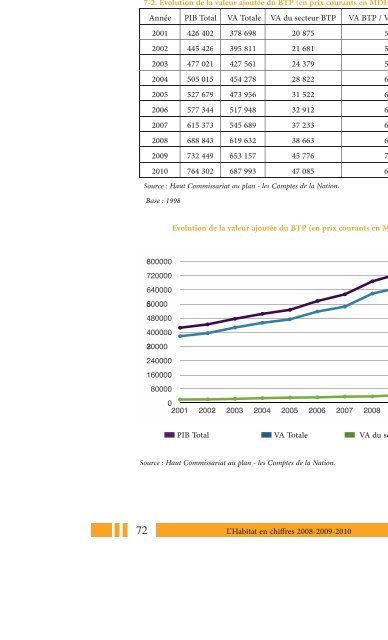
INDICATEURS D’ÉVALUATION DES RÉALISATIONSDU SECTEUR ET AGRÉGATS ECONOMIQUES7-2. Evolution <strong>de</strong> la valeur ajoutée du BTP (<strong>en</strong> prix courants <strong>en</strong> MDH)Année PIB Total VA Totale VA du secteur BTP VA BTP / VA totale (%)2001 426 402 378 698 20 875 5,52002 445 426 395 811 21 681 5,52003 477 021 427 561 24 379 5,72004 505 015 454 278 28 822 6,32005 527 679 473 956 31 522 6,62006 577 344 517 948 32 912 6,42007 615 373 545 689 37 233 6,8<strong>2008</strong> 688 843 619 632 38 663 6,22009 732 449 653 157 45 776 7,0<strong>2010</strong> 764 302 687 993 47 085 6,8Source : Haut Commissariat au plan - les Comptes <strong>de</strong> la Nation.Base : 1998Evolution <strong>de</strong> la valeur ajoutée du BTP (<strong>en</strong> prix courants <strong>en</strong> MDH)8000007200006400005600004800004000003200002400001600008000002001 2002 2003 2004 2005 2006 2007 <strong>2008</strong> 2009 <strong>2010</strong>PIB TotalVA TotaleVA du secteur BTPSource : Haut Commissariat au plan - les Comptes <strong>de</strong> la Nation.72L’<strong>Habitat</strong> <strong>en</strong> chiffres <strong>2008</strong>-2009-<strong>2010</strong>