Monitoraggio sulle autovetture di servizio delle pubbliche ...
Monitoraggio sulle autovetture di servizio delle pubbliche ...
Monitoraggio sulle autovetture di servizio delle pubbliche ...

Create successful ePaper yourself
Turn your PDF publications into a flip-book with our unique Google optimized e-Paper software.
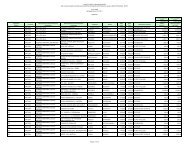
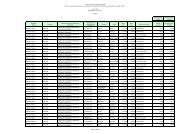
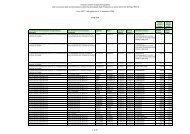
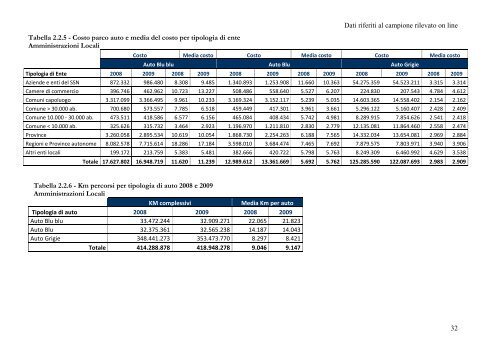
Tabella 2.2.5 - Costo parco auto e me<strong>di</strong>a del costo per tipologia <strong>di</strong> ente<br />
Amministrazioni Locali<br />
Dati riferiti al campione rilevato on line<br />
Costo Me<strong>di</strong>a costo Costo Me<strong>di</strong>a costo Costo Me<strong>di</strong>a costo<br />
Auto Blu blu Auto Blu Auto Grigie<br />
Tipologia <strong>di</strong> Ente 2008 2009 2008 2009 2008 2009 2008 2009 2008 2009 2008 2009<br />
Aziende e enti del SSN 872.332 986.480 8.308 9.485 1.340.893 1.253.908 11.660 10.363 54.275.359 54.523.211 3.315 3.314<br />
Camere <strong>di</strong> commercio 396.746 462.962 10.723 13.227 508.486 558.640 5.527 6.207 224.830 207.543 4.784 4.612<br />
Comuni capoluogo 3.317.099 3.366.495 9.961 10.233 3.169.324 3.152.117 5.239 5.035 14.603.365 14.558.402 2.154 2.162<br />
Comune > 30.000 ab. 700.680 573.557 7.785 6.518 459.449 417.301 3.961 3.661 5.296.122 5.160.407 2.428 2.409<br />
Comune 10.000 ‐ 30.000 ab. 473.511 418.586 6.577 6.156 465.084 408.434 5.742 4.981 8.289.915 7.854.626 2.541 2.418<br />
Comune < 10.000 ab. 325.626 315.732 3.464 2.923 1.196.970 1.211.810 2.830 2.779 12.135.081 11.864.460 2.558 2.474<br />
Province 3.260.058 2.895.534 10.619 10.054 1.868.730 2.254.263 6.188 7.565 14.332.034 13.654.081 2.969 2.884<br />
Regioni e Province autonome 8.082.578 7.715.614 18.286 17.184 3.598.010 3.684.474 7.465 7.692 7.879.575 7.803.971 3.940 3.906<br />
Altri enti locali 199.172 213.759 5.383 5.481 382.666 420.722 5.798 5.763 8.249.309 6.460.992 4.629 3.538<br />
Totale 17.627.802 16.948.719 11.620 11.239 12.989.612 13.361.669 5.692 5.762 125.285.590 122.087.693 2.983 2.909<br />
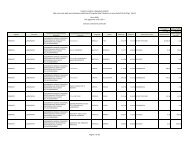
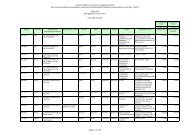
Tabella 2.2.6 - Km percorsi per tipologia <strong>di</strong> auto 2008 e 2009<br />
Amministrazioni Locali<br />
KM complessivi Me<strong>di</strong>a Km per auto<br />
Tipologia <strong>di</strong> auto 2008 2009 2008 2009<br />
Auto Blu blu 33.472.244 32.909.271 22.065 21.823<br />
Auto Blu 32.375.361 32.565.238 14.187 14.043<br />
Auto Grigie 348.441.273 353.473.770 8.297 8.421<br />
Totale 414.288.878 418.948.278 9.046 9.147<br />
32