

activate-use-xdebug
- No tags were found...

Create successful ePaper yourself
Turn your PDF publications into a flip-book with our unique Google optimized e-Paper software.
Xdebug is a powerful open source debugger and profiler for PHP. It is included with XAMPP and can be <strong>use</strong>d<br />
to display stack traces, analyze code coverage and profile your PHP code.<br />
To <strong>activate</strong> Xdebug, follow these steps:<br />
1. Edit the php.ini file in the etc/ subdirectory of your XAMPP installation directory (usually,<br />
/Applications/XAMPP). Within this file, <strong>activate</strong> the Xdebug extension by adding the following line to it:<br />
extension = <strong>xdebug</strong>.so<br />
2. Restart the Apache server using the XAMPP control panel.<br />
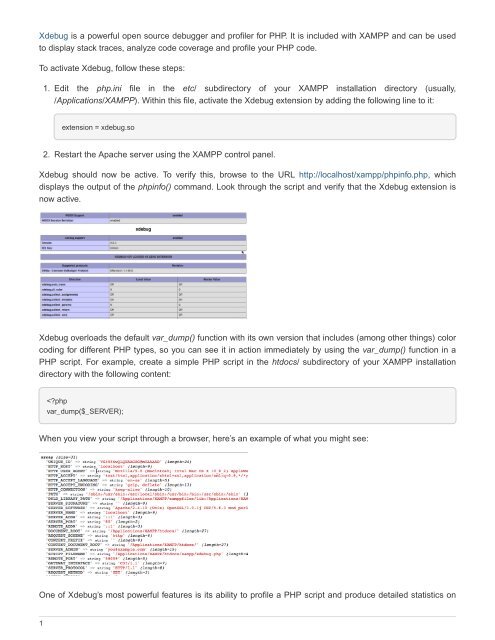
Xdebug should now be active. To verify this, browse to the URL http://localhost/xampp/phpinfo.php, which<br />
displays the output of the phpinfo() command. Look through the script and verify that the Xdebug extension is<br />
now active.<br />
Xdebug overloads the default var_dump() function with its own version that includes (among other things) color<br />
coding for different PHP types, so you can see it in action immediately by using the var_dump() function in a<br />
PHP script. For example, create a simple PHP script in the htdocs/ subdirectory of your XAMPP installation<br />
directory with the following content:<br />