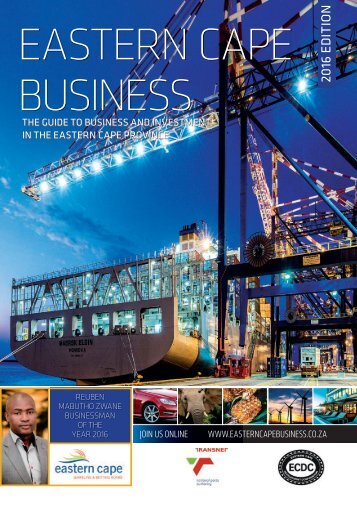
A unique guide to business and investment in the Eastern Cape.
The 2016 edition of Eastern Cape Business is the ninth issue of this highly successful publication that, since its launch in 2006, has established itself as the premier business and investment guide to the Eastern Cape Province.
The Eastern Cape enjoys an abundance of natural and human resources, as well as established industrial infrastructure that drives the economy of the province. This includes three ports, covered extensively in a series of features and interviews in this issue, and two industrial development zones which are home to a wide range of manufacturers and exporters. The 2016 edition includes contributions from the Eastern Cape Development Corporation (ECDC), Mercedes-Benz South Africa, the regional head of Nedbank in the province, as well as an extensive interview with Reuben Zwane, the CEO of the Eastern Cape Gambling & Betting Board and the featured Eastern Cape Businessman of the Year. New for the 2016 edition is a comprehensive 10-page map guide to the province sponsored by Caltex Eastern Cape Marketer.
To complement the extensive local, national and international distribution of the print edition of the magazine (15 000 copies), the full content can also be viewed online at www.easterncapebusiness.co.za. Updated information on the Eastern Cape is also available through our monthly e-newsletter, which you can subscribe to online at www.gan.co.za, in addition to our complementary business-to-business titles that cover all nine provinces as well as our flagship South African Business title.
SPECIAL FEATURE Trading
SPECIAL FEATURE Trading places Trade in the EasternCape has seen impressive growth in recent years, with the province beginning to realise its export potential. Placing a special focus on export will certainly earn the region points when it comes to making a difference in the economy of the province. This is driven by a large increase in vehicle sales and escalating vehicle export figures. However, small business exports should not be discounted when adding up the numbers. Contributing to boosting trade in the province is the fact that two of South Africa’s five industrial development zones (IDZs) are located on its doorstep, increasing potential revenue by the shipping traffic on route to Europe and the Far East. According to the latest EasternCape Socio Economic Consultative Council’s report (ECSECCTP), Trade And Ports Movement In The EasternCape, which provides a detailed trend analysis of selected key traderelated statistics for the EC between 1Q2013 and 1Q2015, the EasternCape was a net importer of goods and services in 2014, which led to a trade account deficit of R11.9-billion in 2013, down to R8.7-billion in 2014. This poor performance of the trade account was influenced by global market conditions, as it’s volatility had a dampening effect on some industries. Between 2003 and 2014 the EasternCape trade balance remained negative, with the exception in 2008, where the province recorded a trade surplus of R1.6-billion, with exports exceeding imports. Looking at how the EC trade account performed over the past decade, the province’s average annual growth of exports was 26.1% over the 10-year period (2005-2014), while the average annual growth of imports was 9.0% in the same period. “The biggest decline in both exports and imports was during the financial crisis in 2009, where exports fell by 42.0% and imports fell by 29.0%. However, in 2011, both exports and imports recovered, with export growth of 17.0% and import growth of 17.4%. In 2014 export grew by 23.9% while import grew by 10.4%,” according to the report. On the provincial and district trade scale, the report reflects that the EasternCape had the fourth largest trade flow, which grew from R78- billion in 2013 to R90-billion in 2014. In terms of exports, the ECSECCTP revealed that the Nelson Mandela Bay Metro Municipality (MM) constitutes the largest exporter, with exports reaching R38 199-million in 2014. The Buffalo City Metro Municipality was the province’s second-largest exporter at R1 268-million in 2014, followed by Cacadu District Municipality (DM) at R1 101-million in the same period . In 2014, all metro and district municipalities experienced increased growth in exports. The OR Tambo DM had the least exports when compared to other municipalities, with total exports reaching R8-million in 2014. Europe was the leading export destination for the province’s exports between 2013 and 2014, with exports estimated to be have risen to R16 865-million in 2014. “The second-largest export destination for the EasternCape was Asia, with exports estimating to be R12 576 million in 2014. Africa was the third-largest export destination, with exports of R5 435-million in 2014. The lowest export destination for the EC was Antarctica with exports of R2 million in 2014. “The largest share of imports into the EC is from Europe with imports of R24 920-million in 2014. Asia is the second largest region to import into the EC, with imports of R27 383-million in 2014, followed by America, with imports of R5 146-million in 2014. There has been a decline in import numbers across region into the EC, importing EASTERN CAPE BUSINESS 2016 52
SPECIAL FEATURE less than they used to import in previous years.” Germany tops the list of top export destination markets for 2014 with R9.8-billion, followed by the United States (R3.8-billion) and China (R3.7-billion), between them accounting for 58.1% of the province’s total exports. Among the top 10 export destinations for South Africa, Japan and the United Kingdom were the fastest growing markets, increasing by 40.1% and 36.1% respectively. Vehicles, aircraft and vessels accounted for R14.2-billion of all exports, with textiles at R4.1-billion. The top three export products from the province accounts for 73.4% of the region’s total export products. Among the top 10 exports, plastics & rubber were the fastest growing products, increasing by 65.3%, followed by chemicals increasing by 64.2%, according to the report. Looking at the BRICS group, according to the DEDE, China is the leading emerging trade market as it imported most of the EasternCape’s exports, followed by India, while Brazil and Russia absorb the least. The EasternCape’s basket of imports from the BRIC countries are dominated by value-added goods driven by manufactured products. Interestingly, between 2007 and 2008 the EasternCape imported the most goods from Brazil, although this changed in 2010 and 2011 as imports to the region from China surpassed those of Brazil. (Sources: EasternCape Socio Economic Consultative Council’s trade report (ECSECCTP), Trade And Ports Movement In The EasternCape; www.southafrica.info; www.dedea.gov.za; 53 EASTERN CAPE BUSINESS 2016