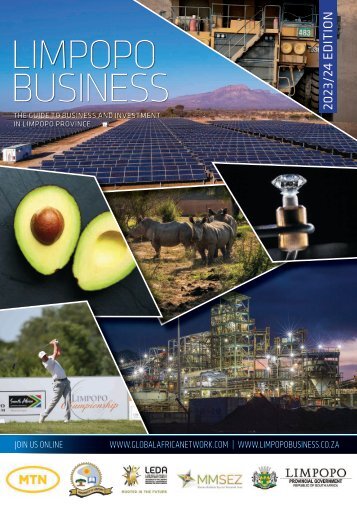
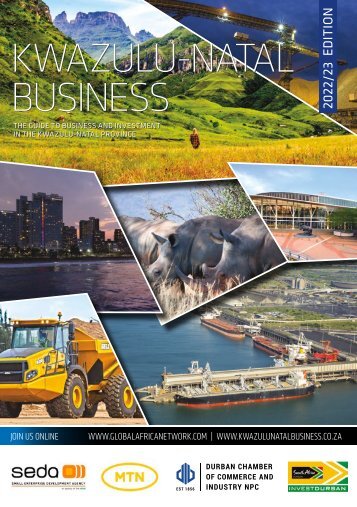
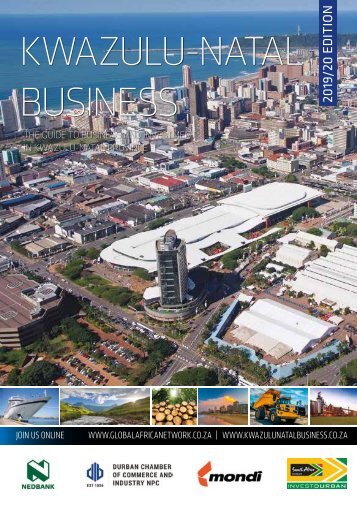
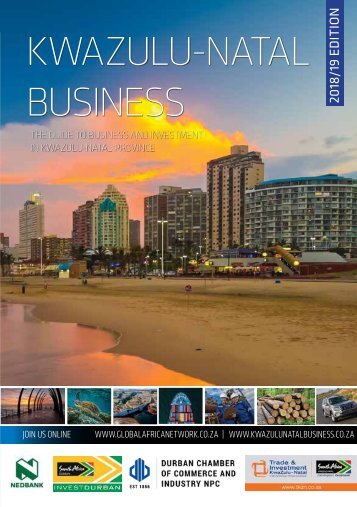
KwaZulu-Natal Business 2017/18 is the ninth edition of this highly successful publication that has, since its launch in 2008, established itself as the premier business and investment guide to the KwaZulu-Natal Province.
The 2017/18 edition includes special features on the Richards Bay area and its increasingly important Industrial Development Zone, the investment appeal of Durban and the growing maritime economy. Up-to-date overviews on the province’s economic sectors provide unique insights.
Global Africa Network Media (www.gan.co.za), the publisher of KwaZulu-Natal Business, specialises in business-to-business print and electronic publications, producing a series of region-specific, annual print journals. Every province in South Africa is covered by this unique range of journals and websites, complemented by a national business guidebook, South African Business.
SPECIAL FEATURE South
SPECIAL FEATURE South African economy at a glance Insight into the performance of the South African economy is provided through these graphical representations of key statistics. ZIMBABWE NAMIBIA BOTSWANA Limpopo 0.9% (7.1%) MOZAMBIQUE North West -3.6% (6.5%) Gauteng 2.1% (34.3%) Mpumalanga 2.7% (7.5%) SWAZI- LAND Northern Cape 2.8% (2.1%) Free State 1.8% (5%) LESOTHO KwaZulu- Natal 2.3% (16.1%) Western Cape 2.0% (13.6%) Eastern Cape 1.0% (7.6%) SA GDP: Percentage of growth per province (2014) and percentage contribution to national GDP (figures in brackets). SOURCE: STATS SA WWW.STATSSA.GOV.ZA PROVINCE CAPITAL PREMIER POPULATION (2015) AREA GRP BILLION RAND Eastern Cape Bhisho Phumulo Masualle 6 916 200 168 966km 2 R289.9 Free State Bloemfontein Elias Sekgobelo "Ace" Magashule 2 817 900 129 825km 2 R189.1 Gauteng Johannesburg David Makhura 13 200 300 18 178km 2 R1 305.6 KwaZulu- Natal Pietermaritzburg Willies Mchunu 10 919 100 94 361km 2 R610.1 Limpopo Polokwane Stanley Mathabatha 5 726 800 125 754km 2 R271.5 Mpumalanga Mbombela David Mabuza 4 283 900 76 495km 2 R284.2 North West Mahikeng Supra Mahumapelo 3 707 000 104 882km 2 R249.5 Northern Cape Kimberley Sylvia Lucas 1 185 600 372 889km 2 R79.9 Western Cape Cape Town Helen Zille 6 200 100 129 462km ² R518.1 Snapshot of South Africa’s provinces SOURCE: INSTITUTE OF RACE RELATION’S SOUTH AFRICA SURVEY 2016 AS REPORTED ON BUSINESSTECH.CO.ZA KWAZULU-NATAL BUSINESS 2017/1818