40 Nr.1 NEering Tabell 59. Sysselsatte lonnstakere. 1 000 Gjennomsnitt Average 1960 1961 1962 1963 1 1964 1965 1966 01 Jordbruk 22,3 19,8 17,9 16,2 15,0 13,8 12,8 02 Skogbruk m. v 21,1 20,1 18,8 16,9 16,0 14,6 12,8 04-06 Fiske og fangst 10,6 10,2 8,2 6,2 6,0 5,6 5,5 11-19 Bergverksdrift m. v 8,2 8,1 7,8 7,4 7,3 7,3 7,3 20 Nringsmiddelindustri 41,6 42,2 42,6 42,4 42,2 42,8 44,1 AV dette: 204 Fiske- og kjetthermetikkfabrikker 6,5 6,4 6,5 5,8 5,8 5,6 5,6 205 Fisketilvirking 7,7 7,8 7,5 7,6 7,6 8,1 8,9 21-22 Drikkevare- og tobakksindustri 5,6 5,8 5,6 5,7 5,6 5,6 5,6 23 Tekstilindustri 18,3 17,9 17,7 18,1 18,2 17,7 17,4 24 Bekledningsindustri m. v 26,6 26,6 26,2 26,3 25,6 24,1 23,4 Av dette: 241-242 Skofabr. og skorep.verkst 5,6 5,3 5,2 5,1 5,1 4,6 4,4 25 Treindustri 13,7 13,5 13,3 12,8 13,1 13,5 13,6 Av dette: 251 Sagbruk og hovlerier 9,4 9,2 9,1 8,8 9,1 9,1 8,7 26 Mabel- og innredningsindustri 13,6 13,8 13,6 13,5 13,6 13,8 13,8 27 Treforedlingsindustri 27,8 28,3 27,8 27,4 27,4 27,1 26,6 28 Grafisk industri, forlag m. v 20,6 21,4 22,1 22,3 22,4 22,7 22,9 29 Lwrindustri 2,3 2,1 1,8 1,8 1,8 1,6 1,6 30 Gummivareindustri 3,5 3,9 4,1 4,1 3,9 4,1 4,4 31-32 Kjem. ind., kull- og min.oljeforedling". 20,9 21,5 21,7 21,8 22,3 23,4 24,4 Av dette: 311 Kjemisk grunnindustri 10,9 11,2 11,8 11,8 11,7 12,2 12,2 312 Olje- og fettindustri 3,5 3,5 3,1 3,1 3,5 3,8 4,6 33 Jord- og steinvareindustri 12,1 12,4 12,5 12,3 12,6 12,9 12,9 34 Primter jern- og metallindustri 22,1 22,9 23,2 22,6 23,5 24,3 24,9 35 Jern- og metallvareindustri 23,6 24,3 24,8 24,9 25,5 26,0 26,2 36 Maskinindustri 12,7 13,7 14,4 14,7 15,1 15,7 16,2 37 Elektroteknisk industri 14,6 15,0 15,5 16,4 16,4 16,8 17,7 38 Transportmiddelindustri 45,7 47,9 49,8 49,5 51,3 54,0 56,7 Av dette: 381 Skipsindustri 27,3 28,7 29,9 28,9 30,1 32,1 34,4 39 Diverse industri 5,6 6,0 6,4 6,6 6,9 7,3 7,4 20-39 Industri i alt 330,9 339,2 343,1 343,2 347,4 353,4 359,8 41 Byggevirksomhet 61,4 62,7 63,6 63,1 63,8 63,8 64,4 42 Anleggsvirksomhet 36,9 37,0 37,5 38,3 37,9 37,7 38,0 51-52 Kraft- og vannforsyning m. v. 12,2 12,6 12,7 13,5 13,8 13,9 14,1 61-66 Varehandel 134,2 139,7 144,0 146,9 150,1 153,4 156,6 Av dette: 64-65 Detaljhandel 84,8 87,3 89,1 90,7 92,4 93,7 94,8 67-69 Finansinstitusjoner og eiendomsdrift 23,6 24,8 26,1 27,2 27,9 29,0 29,9 71-73 Sjetransport 67,1 66,9 66,3 66,8 66,3 64,9 63,7 74-78 Annen samferdsel 70,0 70,3 71,1 71,6 71,9 72,1 72,4 81 Offentlig administrasjon og forsvar 61,8 62,1 63,8 66,2 67,5 68,4 68.9 Av dette: 814 Forsvar 24,0 23,5 24,7 26,3 26,9 26,7 26,4 82 Undervisning 42,3 45,2 48,0 50,8 54,0 57,0 59,7 83 Helse- og veterinzervesen 38,6 40,3 42,2 44,0 45,3 46,6 48,1 84-87 Annet under off. og privat tjenesteyting 40,6 42,5 44,0 45,1 47,5 49,9 52,0 91 Lent husarbeid 22,1 20,3 18,9 17,8 16,6 15,5 14,3 92 Hotell- og restaurantdrift 24,7 25,4 25,9 25,8 26,2 26,6 26,7 93 Vask, rens. og andre pers. tjenester 10,3 10,7 11,0 11,2 10,8 11,0 11,0 61-93 I alt 535,3 548,2 561,3 573,4 584,1 594,4 603,3 01-93 I alt 1 038,9 1 057,9 1 070,9 1 078,2 1 091,3 1 104,5 1118,0 Kilde: NOS Arbeidsmarkedstatistikk. Not e r : 1 I samsvar med Standard for neeringsgruppering i offentlig norsk statistikk. Medregnet 659 sysselsatte pa Svalbard, ikke registrert tidligere. Medregnet 579 sysselsatte i en offentlig bedrift, ikke registrert tidligere. 4 Medregnet 643 sysselsatte i sivil luftfart, ikke registrert tidligere.
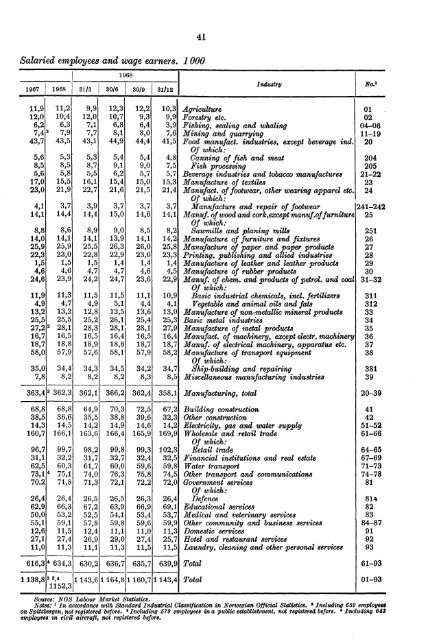
41 Salaried employees and wage earners. 1 000 1968 1967 1968 31/3 30/6 30/9 31/12 Industry N0.1 11,9 11,2 9,9 12,3 12,2 12,0 10,4 12,0 10,7 9,3 6,2 6,3 7,1 6,8 6,4 7,4 2 7,9 7,7 8,1 8,0 43,7 43,5 43,1 44,9 44,4 5,6 5,3 5,3 5,4 5,4 8,5 8,5 8,7 9,1 9,0 5,6 5,8 5,5 6,2 5,7 17,0 15,5 16,1 15,4 15,0 23,0 21,9 22,7 21,6 21,5 4,1 3,7 3,9 3,7 3,7 14,1 14,4 14,4 15,0 14,6 8,8 8,6 8,9 9,0 8,5 14,0 14,1 14,1 13,9 14,1 25,9 25,9 25,5 26,3 26,0 22,3 23,0 22,8 22,9 23,0 1,5 1,5 1,5 1,4 1,4 4,6 4,6 4,7 4,7 4,6 24,6 23,9 24,2 24,7 23,6 11,9 11,3 11,5 11,5 11,1 4,9 4,7 4,9 5,1 4,4 13,2 13,2 12,8 13,5 13,6 25,5 25,5 25,2 26,1 25,4 27,2 28,1 28,3 28,1 28,1 16,7 16,5 16,5 16,4 16,5 18,7 18,8 18,9 18,8 18,7 58,0 57,9 57,6 58,1 57,9 35,0 34,4 34,3 34,5 34,2 7,8 8,2 8,2 8,2 8,3 363,4 3 362,3 362,11 366,2 362,4 68,8 68,8 64,9 70,3 72,5 38,5 36,6 35,5 38,8 39,6 14,3 14,5 14,2 14,9 14,6 160,7 166,1 163,6 166,4 165,9 96,7 99,7 98,2 99,8 99,3 31,1 32,2 31,7 32,7 32,4 62,5 60,3 61,7 60,0 59,6 73,1 4 75,1 74,0 76,3 75,8 70.2 71,8 71,3 72,1 72,2 26,4 26,4 26,5 26,5 26,3 62,9 66,3 67,2 63,9 66,9 50,0 53,2 52,5 54,1 53,4 55,1 59,1 57,8 59,8 59,6 12,6 11,5 12,4 11,1 11,0 27,1 27,4 26,9 29,0 27,4 11,0 11,3 11,1 11,3 11,5 616,3 634,3 630,2 636,7 635,7 10,3 Agriculture 01 . 9,9 Forestry etc. 02 3,9 Fishing, sealing and whaling 04-06 7,6 Mining and quarrying 11-19 41,5 Food manufact. industries, except beverage ind. 20 Of which: 4,8 Canning of fish and meat 204 7,5 Fish processing 205 5,7 Beverage industries and tobacco manufactures 21-22 15,3 Manufacture of textiles 23 21,4 Manufact. of footwear, other wearing apparel etc. 24 Of which: 3,7 Manufacture and repair of footwear 241-242 14,1 Manuf. of wood and cork,except manuf.of furniture 25 Of which: 8,2 Sawmills and planing mills 251 14,2 Manufacture of furniture and fixtures 26 25,8 Manufacture of paper and paper products 27 23,3 Printing, publishing and allied industries 28 1,4 Manufacture of leather and leather products 29 4,5 Manufacture of rubber products 30 22,9 Manuf. of chem. and products of petrol. and coal 31-32 Of which: 10,9 Basic industrial chemicals, incl. fertilizers 311 4,1 Vegetable and animal oils and fats 312 13,0 Manufacture of non-metallic mineral products 33 25,3 Basic metal industries 34 27,9 Manufacture of metal products 35 16,4 Manufact. of machinery, except electr. machinery 36 18,7 Manuf. of electrical machinery, apparatus etc. 37 58,2 Manufacture of transport equipment 38 Of which: 34,7 Ship-building and repairing 381 8,5 Miscellaneous manufacturing industries 39 358,1 Manufacturing, total 20-39 67,2 Building construction 41 32,3 Other construction 42 14,2 Electricity, gas and water supply 51-52 169,9 Wholesale and retail trade 61-66 Of which: 102,3 Retail trade 64-65 32,5 Financial institutions and real estate 67-69 59,8 Water transport 71-73 74,5 Other transport and communications 74-78 72,0 Government services 81 Of which: 26,4 Defence 814 69,1 Educational services 82 53,7 Medical and veterinary services 83 59,9 Other community and business services 84-87 11,3 Domestic services 91 25,7 Hotel and restaurant services 92 11,5 Laundry, cleaning and other personal services 93 639,91 Total 61-93 1 138,8 234 1 143,6f 1 164,8 1 160,7 1 1152,3 143,4 Total 01-93 Source: NOS Labour Market Statistics. Notes: 1 In accordance with Standard Industrial Classification in Norwegian Official Statistics. Including 659 employees on Spitzbergen, not registered before. 3 Including 579 employees in a public establishment, not registered before. Including 643 employees tn civil aircraft, not registered before.
- Page 2 and 3:
PUBLIKASJONER FRA STATISTISK SENTRA
- Page 4 and 5:
} Standardtegn Tall kan ikke foreko
- Page 6 and 7:
Preface The Statistical Yearbook of
- Page 8 and 9:
*6 Tabell Side 11. Hjemmehorende fo
- Page 10 and 11:
*8 Tabell Side 83. Offentlig forval
- Page 12 and 13:
* 1 0 Tabell Side 158. Patenter, va
- Page 14 and 15:
*12 Tabell Side 228. Trafikken pa d
- Page 16 and 17:
*14 Tabell Side 299. Aksjeutbytte 2
- Page 18 and 19:
*16 Tabell 363. Domfelte, botlagte
- Page 20 and 21:
*18 Side Administrative delinger 2
- Page 22 and 23: *20 Side Forsikring, privat- . . .
- Page 24 and 25: *22 Side Likviditetstilforsel 237 L
- Page 26 and 27: *24 Side Skipsfrakter, indeks 153 S
- Page 28 and 29: 26 Page Accident insurance . . . .
- Page 30 and 31: *28 Page Handicapped children, scho
- Page 32 and 33: *30 Page prices 239 Timber floating
- Page 34 and 35: 2 Tabell 2. Administrative inndelin
- Page 36 and 37: 4 Tabell 3 (forts.). Meteorologiske
- Page 38 and 39: Fylke County 6 Tabell 6. Flateinnho
- Page 40 and 41: 8 Tabell 8 (forts.). Hjemmehorende
- Page 42 and 43: 10 Tabell 9. Hjemmehorende folkemen
- Page 44 and 45: Hele landet The whole country 1930
- Page 46 and 47: 14 Tabell 16. Private husholdninger
- Page 48 and 49: 16 Tabell 18. Folkemengdens bevegel
- Page 50 and 51: 1 8 Tabell 20. Inngatte ekteskap et
- Page 52 and 53: 20 Tabell 26. Fate og dodfodte Live
- Page 54 and 55: 22 Arlig gjennomsnitt Annual averag
- Page 56 and 57: 24 Tabell 34. Dodeligheten etter fy
- Page 58 and 59: 26 TabeIl 37. Dodelighetstabeller.
- Page 60 and 61: 28 Tabell 40. Flyttere mellow grupp
- Page 62 and 63: 30 Tabell 44. Pasienter og pasientv
- Page 64 and 65: Forkort. intern. nomenklatur av 195
- Page 66 and 67: I Arlig gjennornsni tt Annual avera
- Page 68 and 69: 36 Tabell 53. Dodsfall ved yrkesuly
- Page 70 and 71: 38 Tabell 56. Vernepliktige etter s
- Page 74 and 75: 42 Tabell 60. Sysselsatte lonnstake
- Page 76 and 77: 44 Tabell 64. Utlendinger i arbeid
- Page 78 and 79: 46 Tabell 67. Faktisk arbeidstid pr
- Page 80 and 81: 48 Tabell 72. Landsorganisasjonen i
- Page 82 and 83: 50 Tabell 73 (forts.). Arbeidstaker
- Page 84 and 85: 5 2 Tabell 75. Nasjonalprodukt ette
- Page 86 and 87: Tabell 78. Faktorinntekt etter near
- Page 88 and 89: 56 Tabell 82. Private inntekter og
- Page 90 and 91: 58 Tabell 85 (forts.). Utenriksregn
- Page 92 and 93: 60 Fylke County Tabell 87. Landarea
- Page 94 and 95: 62 Tabell 93. Jordbruksarealet ette
- Page 96 and 97: 64 Tabell 94. Husdyr etter fylke. 2
- Page 98 and 99: 66 Tabell 95. Brukene etter jordbru
- Page 100 and 101: 68 Ar Year Tabell 100. Forbruk av k
- Page 102 and 103: 70 Tabell 104. Avling i hagebruket.
- Page 104 and 105: 72 Ar og maned Year and month Tabel
- Page 106 and 107: 74 Ar Year Distrikt District Brukss
- Page 108 and 109: 76 Tabell 112. Gjennomsnittspris pr
- Page 110 and 111: 78 Tabell 115. Skogeiendommer etter
- Page 112 and 113: 80 Tabell 117. Skogeiendommers land
- Page 114 and 115: 82 Tabell 121. Skogtaksering. Arlig
- Page 116 and 117: 84 Tabell 125. Skogavgift. 1 1000 k
- Page 118 and 119: 86 Ar og fylke m.v. Year and county
- Page 120 and 121: 88 Fiskeslag Enhet Unity 1966 I 196
- Page 122 and 123:
90 A r Year Tone 1950 1 278 668 195
- Page 124 and 125:
92 Ar Year 1964... 1965... 1966...
- Page 126 and 127:
94 Tabell 144. Laks- og sjoaurefisk
- Page 128 and 129:
96 Tabell 147. Hvalfangstenl Whalin
- Page 130 and 131:
9 8 Tabell 150. Bergverksdrift og i
- Page 132 and 133:
100 Fylke County Tabell 151. Bergve
- Page 134 and 135:
102 Tabell 153 (forts.). Bergverksd
- Page 136 and 137:
104 Tabell 153 (forts.). Bergverksd
- Page 138 and 139:
106 Tabell 154. Meieridrift Dairyin
- Page 140 and 141:
108 Tabell 156. Indekser over produ
- Page 142 and 143:
110 Tabell 159. Bergverksdrift og i
- Page 144 and 145:
112 Ar Year Fylke County I alt Tota
- Page 146 and 147:
114 Tabell 166. Maskininstallasjon
- Page 148 and 149:
116 Tabell 170. Byggevirksomhet Bui
- Page 150 and 151:
118 Tabell 173 (forts.). Innforsel
- Page 152 and 153:
120 Tabell 173 (forts.). Innforsel
- Page 154 and 155:
Innforsel (forts.). Vare Commodity
- Page 156 and 157:
124 Tabell 173 (forts.). Innforsel
- Page 158 and 159:
Utforsel (forts.). 126 Tabell 173 (
- Page 160 and 161:
128 Tabell 174. Indekser for utenri
- Page 162 and 163:
130 Tabell 175. Innforsels- og utfo
- Page 164 and 165:
132 Tabell 175 (forts.). Innforsels
- Page 166 and 167:
134 Tabell 175 (forts.). Innforsels
- Page 168 and 169:
136 Tabell 176. Innforsels- og utfo
- Page 170 and 171:
138 Tabell 176 (forts.). Innforsels
- Page 172 and 173:
140 Tabell 177. Innforsels- og utfo
- Page 174 and 175:
142 Tabell 179. Engros- og detaljha
- Page 176 and 177:
144 Tabell 183. Verdiindeks for det
- Page 178 and 179:
146 Tabell 185. Volumindeks over la
- Page 180 and 181:
Ar Year Lag Association 148 Tabell
- Page 182 and 183:
150 Tabell 192. Handelsflittenl ett
- Page 184 and 185:
152 Fylke County Tabell 196. Regist
- Page 186 and 187:
154 Ar Year Tabell 201. Skipsfarten
- Page 188 and 189:
Land og havn Country and port Europ
- Page 190 and 191:
Land og havn Country and port Samba
- Page 192 and 193:
160 Tabell 205. Kystfartl Coa8ting
- Page 194 and 195:
162 Tabell 209. Statsbanene : Drift
- Page 196 and 197:
164 Tabell 214. Forstadsbaner Subur
- Page 198 and 199:
166 Ar og opprinnelsesland Year and
- Page 200 and 201:
168 Ar og fylke Year and county Tab
- Page 202 and 203:
170 Tabell 226. Veitrafikkulykkerl
- Page 204 and 205:
Flytype Type of aircraft Turbo-jet:
- Page 206 and 207:
174 Ar og mined Year and month ipne
- Page 208 and 209:
176 Tabell 237. Poststeder, syssels
- Page 210 and 211:
178 Tabell 241. Telegrafverket. Sta
- Page 212 and 213:
180 Tabell 245. Telegrafverkets dri
- Page 214 and 215:
182 Tabell 250. Oversikt over skatt
- Page 216 and 217:
Fylke County 1966 Ostfold Akershus
- Page 218 and 219:
186 Tabell 253 (forts.). Personlige
- Page 220 and 221:
188 Tabell 256. Kommunenes balanse.
- Page 222 and 223:
190 Tabell 258. Kommunenes utgifter
- Page 224 and 225:
Nettoutgifter Administrasj on 1 014
- Page 226 and 227:
194 Aktiva Assets Tabell 260. State
- Page 228 and 229:
196 Tabell 261. Statsgjelden. 1 Mil
- Page 230 and 231:
198 Tabell 262. Statskassens (bevil
- Page 232 and 233:
200 Tabell 262 (forts.). Statskasse
- Page 234 and 235:
202 Tabell 262 (forts.). Statskasse
- Page 236 and 237:
204 Tabell 262 (forts.). Statskasse
- Page 238 and 239:
206 Tabell 262 (forts.). Statskasse
- Page 240 and 241:
208 Tabell 265. Norges Bank. Drifts
- Page 242 and 243:
210 Tabell 269. Statsbanker. Utlans
- Page 244 and 245:
212 Tabell 271. Forretningsbanker.
- Page 246 and 247:
214 Tabell 274. Sparebanker. Utestf
- Page 248 and 249:
216 Tabell 277. Forretnings- og spa
- Page 250 and 251:
218 Tabell 279. Kredittforeninger o
- Page 252 and 253:
220 Utlinsform Type of loan Tabell
- Page 254 and 255:
222 Tallet pa selskaper Number of c
- Page 256 and 257:
224 Tabell 289. Norgee Brannkasse.
- Page 258 and 259:
226 Tabell 292. Ihendehaverobligasj
- Page 260 and 261:
228 Tabell 295. NEerin.genes lim. 1
- Page 262 and 263:
230 Noaring/Land Tabell 296. Fordri
- Page 264 and 265:
232 Tabell 297. Finansielle balanse
- Page 266 and 267:
234 Tabell 297 (forts.). Finansiell
- Page 268 and 269:
236 Tabell, 298. Valutakurser' Fore
- Page 270 and 271:
fir Hvete Year Wheat 238 Tabell 303
- Page 272 and 273:
240 Tabell 309. Gjennomsnittspriser
- Page 274 and 275:
242 Ar Year Tabell 313. Konsumprisi
- Page 276 and 277:
244 Tabell 316. Husholdningenes gje
- Page 278 and 279:
246 Tabell 318. Timefortjeneste i b
- Page 280 and 281:
248 Tabell 318 (forts.). Timefortje
- Page 282 and 283:
250 Tabell 321. Timefortjeneste for
- Page 284 and 285:
252 Tabell 324. Minedsfortjenestel
- Page 286 and 287:
254 Tabell 326. Mfinedsfortjenestel
- Page 288 and 289:
256 Tabell 329. Mfinedsfortjenestel
- Page 290 and 291:
258 Tabell 331. Syketrygden. Gjenno
- Page 292 and 293:
Trygdeart Type of b enefit Alderspe
- Page 294 and 295:
262 Fylke County Tabell 337. Folket
- Page 296 and 297:
264 Tabell 341. Folketrygden. Barne
- Page 298 and 299:
266 Tabell 344. Kommunale' trygder
- Page 300 and 301:
Kjenn og alder Sex and age Gutter B
- Page 302 and 303:
Ar Year 270 Tabell 351. Edruskapsne
- Page 304 and 305:
272 Tabell 357. Forbruki av brennev
- Page 306 and 307:
274 Tabell 361. Siktede for forbryt
- Page 308 and 309:
276 Tabell 367. Domfelte og botlagt
- Page 310 and 311:
278 Tabell 372. Tvistemfil avgjort
- Page 312 and 313:
280 1962 1963 1964 1965 1966 1967 1
- Page 314 and 315:
282 Tabell 379. Elever i kirneskole
- Page 316 and 317:
284 Tabell 385. Fag- og yrkesskoler
- Page 318 and 319:
286 Tabell 387. Universiteter og ho
- Page 320 and 321:
288 Tabell 390. Spesialbibliotek 19
- Page 322 and 323:
290 Tabell 390 (forts.). Spesialbib
- Page 324 and 325:
292 1962 1963 1964 1965 1966 1967 A
- Page 326 and 327:
294 Fylke County Bykomm. Urban muni
- Page 328 and 329:
296 Tabell 402. Stortingsvalg. Pers
- Page 330 and 331:
298 Tabell 404. Kommunevalg. Person
- Page 332 and 333:
300 Tabell 405. Kommunevalg. Stemme
- Page 334 and 335:
Luftens mid- 1Normal' deltemperatur
- Page 336 and 337:
304 Tabell 409 (forts.). Areal, fol
- Page 338 and 339:
306 Tabell 409 (forts.). Areal, fol
- Page 340 and 341:
308 Tabell 409 (forts.). Areal, fol
- Page 342 and 343:
310 Tabell 410 (forts.). Folkemengd
- Page 344 and 345:
312 Tabell 411. Folkemengden etter
- Page 346 and 347:
314 Tabell 411 (forts.). Folkemengd
- Page 348 and 349:
316 Tabell 413. Giftermal, fodsler
- Page 350 and 351:
318 Tabell 414. Fruktbarheten etter
- Page 352 and 353:
320 Tabell 416. Dode pr. 1 000 innb
- Page 354 and 355:
Skottland Spania 1 1930- M. i 1932
- Page 356 and 357:
324 Tabell 417. Dode pr. 100 000 Nr
- Page 358 and 359:
326 Tabell 418. Arbeidelose. 1 1 00
- Page 360 and 361:
328 Tabell 420. Utenriksregnskap. 1
- Page 362 and 363:
330 Tabeil 422. Landareal, jord- Ar
- Page 364 and 365:
332 Land Ar I alt Ferskv.- fisk Tab
- Page 366 and 367:
334 Tabell 425. Produksjonsindeks f
- Page 368 and 369:
336 Varesort og land I 1964 1 1985
- Page 370 and 371:
338 Tabell 426 (forts.). Produksjon
- Page 372 and 373:
340 Tabell 426 (forts.). Produksjon
- Page 374 and 375:
342 Tabell 426 (forts.). Produksjon
- Page 376 and 377:
344 Tabell 427. Produksjon av elekt
- Page 378 and 379:
346 Tabell 430. Verdien av forskjel
- Page 380 and 381:
348 Tabell 431. Frihandelsforbundet
- Page 382 and 383:
Innforsel. 1 000 t. 1091 138 98 164
- Page 384 and 385:
352 Tabell 434 (forts.). Innforsel
- Page 386 and 387:
354 Tabell 434 (forts.). Innforsel
- Page 388 and 389:
Land 356 Tabell 435. Registrerte sk
- Page 390 and 391:
358 Handelsflaten pr. 31/12 1967, i
- Page 392 and 393:
Land 360 Tabell 440. Jernbanenel Tr
- Page 394 and 395:
362 Tabell 442. Veitrafikkulykker i
- Page 396 and 397:
364 Tabell 445. Flyselskapenes rute
- Page 398 and 399:
366 Tabell 447. Telegraf- og telefo
- Page 400 and 401:
368 Tabell 449. Internasjonal likvi
- Page 402 and 403:
370 Tabell 453. Engrosprisindeke. 1
- Page 404 and 405:
372 Land fir' Tabell 455. Forbruket
- Page 406 and 407:
Land 374 Tabell 457. Forbruket av n
- Page 408 and 409:
Land og studium Norge Teologi Jus F
- Page 410 and 411:
1 cm = 0,3937 inch m = f3,2808 feet
- Page 412 and 413:
380 Rekke XII Boktrykk 1969 Nr. 240
- Page 414 and 415:
Andre publikasjoner Veiviser i nors