Nível de atividade física de crianças e adolescentes órfãos ... - SciELO
Nível de atividade física de crianças e adolescentes órfãos ... - SciELO
Nível de atividade física de crianças e adolescentes órfãos ... - SciELO

You also want an ePaper? Increase the reach of your titles
YUMPU automatically turns print PDFs into web optimized ePapers that Google loves.
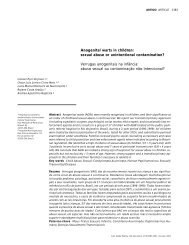
Tabela 1 - Distribuição total e estratificada por sexo das <strong>crianças</strong> e <strong>adolescentes</strong> <strong>órfãos</strong> em <strong>de</strong>corrência da aids segundo<br />
características socio<strong>de</strong>mográficas. Município <strong>de</strong> São Paulo, 2007. (n = 235)<br />
Table 1 - Overall and stratified by sex distribution of children and adolescents orphaned by AIDS according to socio<strong>de</strong>mographic<br />
characteristics. Municipality of São Paulo, 2007. (N = 235)<br />
Total Masculino Feminino<br />
Variável n % IC(95%) n % IC(95%) n % IC(95%)<br />
Ida<strong>de</strong> (anos)<br />
07|---10 77 (32,0) (25,5;39,3) 32 (27,8) (19,1;38,5) 45 (35,6) (27,4;44,8)<br />
10|---13 96 (41,2) (35,5;47,1) 44 (42,0) (32,7;51,8) 52 (40,6) (32,4;49,4)<br />
13|---15 62 (26,7) (21,2;33,0) 32 (30,2) (21,9;40,2) 30 (23,8) (16,0;33,7)<br />
Tipo <strong>de</strong> orfanda<strong>de</strong><br />
<strong>Nível</strong> <strong>de</strong> ativida<strong>de</strong> <strong>física</strong> <strong>de</strong> <strong>crianças</strong> e <strong>adolescentes</strong> <strong>órfãos</strong> por aids<br />
Barros, C.R.S. et al.<br />
449<br />
p= 0,4189<br />
Paterno 114 (48,5) (40,7;56,5) 50 (46,4) (36,1;57,0) 64 (50,3) (40,7;60,0)<br />
Materno 68 (29,0) (22,6;36,5) 30 (28,1) (19,9;38,0) 38 (29,9) (21,6;39,7)<br />
Ambos 53 (22,5) (15,6;31,1) 28 (25,5) (16,8;36,8) 25 (19,8) (12,6;29,6)<br />
Condição sorológica<br />
p=0,548<br />
Soropositivo para o HIV 12 (5,5) (3,0;9,7) 5 (5,3) (2,2;12,3) 7 5,5 (2,4;12,5)<br />
Soronegativo para o<br />
HIV<br />
Não sabe a condição<br />
sorológica<br />
Cor da pele<br />
165 (69,2) (61,3;76,1) 79 (70,7) (59,8;79,6) 86 68,0 (56,6;77,6)<br />
58 (25,3) (18,7;33,4) 24 (24,0) (16,5;33,6) 34 26,5 (17,2;38,4)<br />
p= 0,919<br />
Branca 99 (43,7) (35,4;52,3) 46 (44,0) (33,6;54,8) 53 (43,5) (34,0;53,5)<br />
Não branca 136 (56,3) (47,6;64,6) 62 (56,0) (45,2;66,4) 74 (56,5) (46,5;66,0)<br />
Tipo cuidador<br />
p=0,935<br />
Um dos pais 109 (46,9) (38,4;55,5) 54 (50,4) (38,1;62,7) 55 (43,8) (32,7;55,4)<br />
Outros familiares 104 (43,1) (34,0;52,7) 48 (42,6) (30,8;55,2) 56 (43,6) (32,2;55,8)<br />
Não familiares 22 (10,0) (6,2;15,6) 6 (7,0) (3,1;15,0) 16 (12,6) (7,1;21,4)<br />
Escore econômico #<br />
p=0,429<br />
Escore 1 (P25) 75 (31,1) (22,8;40,9) 32 (28,2) (17,8;41,5) 43 (33,6) (23,7;45,2)<br />
Escore 2 (P50) 62 (26,9) (19,0;36,6) 36 (33,4) (22,9;45,8) 26 (21,3) (13,2;32,6)<br />
Escore 3 (P75) 93 (42,0) (33,5;50,9) 38 (38,4) (27,0;51,2) 55 (45,1) (34,9;55,6)<br />
Renda per capita ##218<br />
< R$ 380,00 186 (84,1) (76,3;89,7) 82 (81,6) (68,7;89,9) 104 (86,1) (77,4;91,8)<br />
0,1783<br />
≥ R$ 380,00 32 (15,9) (10,3;23,7) 16 (18,4) (10,1;31,2) 16 (13,9) (8,2;22,6)<br />
Anos <strong>de</strong> estudo<br />
p=0,415<br />
0 - 4 95 (39,9) (31,5;48,9) 44 (39,3) (28,9;50,6) 51 (40,4) (29,4;52,4)<br />
5 - 9 74 (32,0) (24,7;40,2) 31 (29,6) (21,7;38,9) 43 (34,0) (24,3;45,2)<br />
Acima <strong>de</strong> 9 66 (28,1) (21,8;35,5) 33 (31,1) (21,6;42,4) 33 (25,6) (18,1;34,9)<br />
p=0,643<br />
# 5 <strong>crianças</strong> excluídas porque moravam em instituição / # 5 institutionalized children were exclu<strong>de</strong>d from the sample<br />
## 5 <strong>crianças</strong> moravam em instituição e 12 cuidadores não souberam informar a renda mensal / ## 5 institutionalized children and 12 caregivers were not able<br />
to inform monthly income<br />
Rev Bras Epi<strong>de</strong>miol<br />
2010; 13(3): 446-56