Estudo da Hidrodinâmica de Colunas Pulsadas Aplicada ao - UFSM
Estudo da Hidrodinâmica de Colunas Pulsadas Aplicada ao - UFSM
Estudo da Hidrodinâmica de Colunas Pulsadas Aplicada ao - UFSM

Create successful ePaper yourself
Turn your PDF publications into a flip-book with our unique Google optimized e-Paper software.
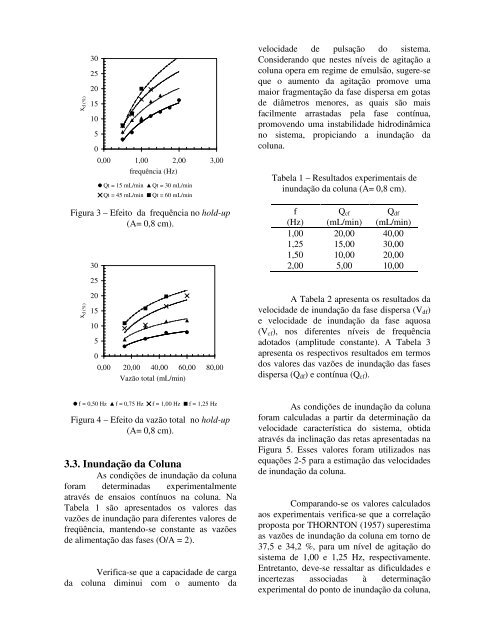
x d (%)<br />
30<br />
25<br />
20<br />
15<br />
10<br />
5<br />
0<br />
0,00 1,00 2,00 3,00<br />
frequência (Hz)<br />
Qt = 15 mL/min Qt = 30 mL/min<br />
Qt = 45 mL/min Qt = 60 mL/min<br />
Figura 3 – Efeito <strong>da</strong> frequência no hold-up<br />
(A= 0,8 cm).<br />
x d (%)<br />
30<br />
25<br />
20<br />
15<br />
10<br />
5<br />
0<br />
0,00 20,00 40,00 60,00 80,00<br />
Vazão total (mL/min)<br />
f = 0,50 Hz f = 0,75 Hz f = 1,00 Hz f = 1,25 Hz<br />
Figura 4 – Efeito <strong>da</strong> vazão total no hold-up<br />
(A= 0,8 cm).<br />
3.3. Inun<strong>da</strong>ção <strong>da</strong> Coluna<br />
As condições <strong>de</strong> inun<strong>da</strong>ção <strong>da</strong> coluna<br />
foram <strong>de</strong>termina<strong>da</strong>s experimentalmente<br />
através <strong>de</strong> ensaios contínuos na coluna. Na<br />
Tabela 1 são apresentados os valores <strong>da</strong>s<br />
vazões <strong>de</strong> inun<strong>da</strong>ção para diferentes valores <strong>de</strong><br />
freqüência, mantendo-se constante as vazões<br />
<strong>de</strong> alimentação <strong>da</strong>s fases (O/A = 2).<br />
Verifica-se que a capaci<strong>da</strong><strong>de</strong> <strong>de</strong> carga<br />
<strong>da</strong> coluna diminui com o aumento <strong>da</strong><br />
veloci<strong>da</strong><strong>de</strong> <strong>de</strong> pulsação do sistema.<br />
Consi<strong>de</strong>rando que nestes níveis <strong>de</strong> agitação a<br />
coluna opera em regime <strong>de</strong> emulsão, sugere-se<br />
que o aumento <strong>da</strong> agitação promove uma<br />
maior fragmentação <strong>da</strong> fase dispersa em gotas<br />
<strong>de</strong> diâmetros menores, as quais são mais<br />
facilmente arrasta<strong>da</strong>s pela fase contínua,<br />
promovendo uma instabili<strong>da</strong><strong>de</strong> hidrodinâmica<br />
no sistema, propiciando a inun<strong>da</strong>ção <strong>da</strong><br />
coluna.<br />
Tabela 1 – Resultados experimentais <strong>de</strong><br />
inun<strong>da</strong>ção <strong>da</strong> coluna (A= 0,8 cm).<br />
f Qcf<br />
(Hz) (mL/min)<br />
1,00 20,00 40,00<br />
1,25 15,00 30,00<br />
1,50 10,00 20,00<br />
2,00 5,00 10,00<br />
Qdf<br />
(mL/min)<br />
A Tabela 2 apresenta os resultados <strong>da</strong><br />
veloci<strong>da</strong><strong>de</strong> <strong>de</strong> inun<strong>da</strong>ção <strong>da</strong> fase dispersa (Vdf)<br />
e veloci<strong>da</strong><strong>de</strong> <strong>de</strong> inun<strong>da</strong>ção <strong>da</strong> fase aquosa<br />
(Vcf), nos diferentes níveis <strong>de</strong> frequência<br />
adotados (amplitu<strong>de</strong> constante). A Tabela 3<br />
apresenta os respectivos resultados em termos<br />
dos valores <strong>da</strong>s vazões <strong>de</strong> inun<strong>da</strong>ção <strong>da</strong>s fases<br />
dispersa (Qdf) e contínua (Qcf).<br />
As condições <strong>de</strong> inun<strong>da</strong>ção <strong>da</strong> coluna<br />
foram calcula<strong>da</strong>s a partir <strong>da</strong> <strong>de</strong>terminação <strong>da</strong><br />
veloci<strong>da</strong><strong>de</strong> característica do sistema, obti<strong>da</strong><br />
através <strong>da</strong> inclinação <strong>da</strong>s retas apresenta<strong>da</strong>s na<br />
Figura 5. Esses valores foram utilizados nas<br />
equações 2-5 para a estimação <strong>da</strong>s veloci<strong>da</strong><strong>de</strong>s<br />
<strong>de</strong> inun<strong>da</strong>ção <strong>da</strong> coluna.<br />
Comparando-se os valores calculados<br />
<strong>ao</strong>s experimentais verifica-se que a correlação<br />
proposta por THORNTON (1957) superestima<br />
as vazões <strong>de</strong> inun<strong>da</strong>ção <strong>da</strong> coluna em torno <strong>de</strong><br />
37,5 e 34,2 %, para um nível <strong>de</strong> agitação do<br />
sistema <strong>de</strong> 1,00 e 1,25 Hz, respectivamente.<br />
Entretanto, <strong>de</strong>ve-se ressaltar as dificul<strong>da</strong><strong>de</strong>s e<br />
incertezas associa<strong>da</strong>s à <strong>de</strong>terminação<br />
experimental do ponto <strong>de</strong> inun<strong>da</strong>ção <strong>da</strong> coluna,