timor-leste in figures timor-leste em números - Direcção Nacional de ...
timor-leste in figures timor-leste em números - Direcção Nacional de ...
timor-leste in figures timor-leste em números - Direcção Nacional de ...

You also want an ePaper? Increase the reach of your titles
YUMPU automatically turns print PDFs into web optimized ePapers that Google loves.
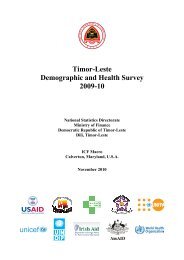
População por Faixa etària e por <strong>Nacional</strong>ida<strong>de</strong>, 2010<br />
Population by Age groups and by Citi zenship, 2010<br />
24<br />
Citizenship,<br />
Age groups<br />
All Ages<br />
and sexes<br />
0-4 ,5-9 ,10-14 ,15-19 20-24 25-29 30-34 35-39 40-44 45-49 50-54 55-59 60 +<br />
Timor - Leste 1 055 426 152 709 152 641 135 062 116 058 93 485 75 420 50 314 56 052 47 173 37 931 29 539 22 035 87 007<br />
Indonesia 5 501 278 200 171 258 582 783 889 743 559 423 226 140 249<br />
Ch<strong>in</strong>a 1 139 16 5 6 34 100 150 146 196 208 184 52 17 25<br />
Vietnam 199 19 29 20 14 19 18 15 14 15 11 8 5 12<br />
Thailand 148 18 18 10 7 13 6 14 13 7 9 14 5 12<br />
Malaysia 165 16 11 10 5 21 23 14 9 16 20 11 4 5<br />
Philip<strong>in</strong>as 726 35 33 29 17 47 70 100 107 94 74 50 24 46<br />
S<strong>in</strong>gapura 72 4 1 x x 3 11 11 5 10 9 4 10 4<br />
Bangla<strong>de</strong>sh 127 16 10 16 9 7 8 15 18 14 6 3 x 5<br />
Pakistan 234 17 23 18 17 16 32 31 25 18 14 11 5 7<br />
Other Asian C. 567 81 55 57 66 63 62 54 34 32 25 12 9 17<br />
Austarlia 517 31 21 12 16 19 51 54 55 42 65 50 33 68<br />
New Zealand 171 23 11 9 10 7 14 12 29 17 11 8 7 13<br />
Portugal 318 16 12 11 6 11 52 56 46 34 31 12 6 25<br />
Other European C. 141 5 5 1 2 7 16 29 16 14 12 12 12 10<br />
The USA 69 3 4 x 3 6 13 8 5 10 4 7 3 3<br />
Brazil 188 16 15 9 3 3 26 32 24 18 9 13 6 14<br />
Cuba 105 x x x 2 x 7 10 22 29 17 8 9 1<br />
Other American C. 37 2 x x 1 3 7 6 5 4 4 2 2 1<br />
Other Pacific C. 26 5 x 2 x 1 5 5 x 1 4 3 x x<br />
Other African C. 188 5 x 2 x 1 5 5 x 1 4 3 x x<br />
Other Countries 345 19 11 8 3 9 44 72 53 32 31 17 11 35<br />
Total 1 066 409 153 334 153 108 135 464 116 535 94 427 76 836 51 911 57 508 48 372 38 917 30 084 22 346 87 567<br />
Timor-Leste <strong>em</strong> Números, 2011<br />
Fonte/Source: <strong>Direcção</strong> <strong>Nacional</strong> <strong>de</strong> Estatistica/National Statistics Directorate of Timor-Leste<br />
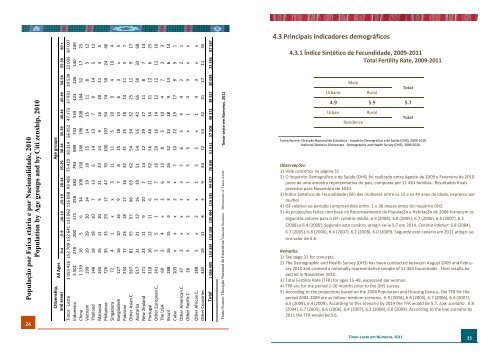
4.3 Pr<strong>in</strong>cipais <strong>in</strong>dicadores d<strong>em</strong>ográficos<br />
4.3.1 Índice S<strong>in</strong>tético <strong>de</strong> Fecundida<strong>de</strong>, 2009-2011<br />
Total Fertility Rate, 2009-2011<br />
Meio<br />
Urbano Rural<br />
Timor-Leste <strong>em</strong> Números, 2011<br />
Total<br />
4.9 5.9 5.7<br />
Urban Rural<br />
Resi<strong>de</strong>nce<br />
Total<br />
Fonte/Source: <strong>Direcção</strong> <strong>Nacional</strong> <strong>de</strong> Estatística - Inquérito D<strong>em</strong>ográfico e <strong>de</strong> Saú<strong>de</strong> (DHS), 2009-2010.<br />
National Statistics Directorate - D<strong>em</strong>ographic and Health Survey (DHS), 2009-2010.<br />
Observações:<br />
1) Vi<strong>de</strong> conceitos na pág<strong>in</strong>a 31.<br />
2) O Inquérito D<strong>em</strong>ográfico e <strong>de</strong> Saú<strong>de</strong> (DHS) foi realizado entre Agosto <strong>de</strong> 2009 e Fevereiro <strong>de</strong> 2010<br />
junto <strong>de</strong> uma amostra representativa do país, composta por 11 463 famílias. Resultados f<strong>in</strong>ais<br />
previstos para Nov<strong>em</strong>bro <strong>de</strong> 2010.<br />
3) Índice S<strong>in</strong>tético <strong>de</strong> Fecundida<strong>de</strong> (ISF) das mulheres entre os 15 e os 49 anos <strong>de</strong> ida<strong>de</strong>, expresso por<br />
mulher.<br />
4) ISF relativo ao período compreendido entre 1 e 36 meses antes do <strong>in</strong>quérito DHS.<br />
5) As projecções feitas com base no Recenseamento da População e Habitação <strong>de</strong> 2004 fornec<strong>em</strong> os<br />
segu<strong>in</strong>tes valores para o ISF: cenário médio, 6.9 (2004), 6.8 (2005), 6.7 (2006), 6.6 (2007), 6.5<br />
(2008) e 6.4 (2009). Segundo este cenário, at<strong>in</strong>gir-se-ia 5.7 <strong>em</strong> 2014. Cenário <strong>in</strong>ferior: 6.8 (2004),<br />
6.7 (2005), 6.6 (2006), 6.4 (2007), 6.2 (2008), 6.0 (2009). Segundo este cenário <strong>em</strong> 2011 at<strong>in</strong>gir-seia<br />
o valor <strong>de</strong> 5.6.<br />
R<strong>em</strong>arks:<br />
1) See page 31 for concepts .<br />
2) The D<strong>em</strong>ographic and Health Survey (DHS) has been conducted between August 2009 and February<br />
2010 and covered a nationally representative sample of 11 463 households. F<strong>in</strong>al results expected<br />
<strong>in</strong> Nov<strong>em</strong>ber 2010.<br />
3) Total Fertility Rate (TFR) for ages 15-49, expressed per woman.<br />
4) TFR are for the period 1-36 months prior to the DHS survey.<br />
5) Accord<strong>in</strong>g to the projections based on the 2004 Population and Hous<strong>in</strong>g Census, the TFR for the<br />
period 2004-2009 are as follow: medium scenario, 6.9 (2004), 6.8 (2005), 6.7 (2006), 6.6 (2007),<br />
6.5 (2008), 6.4 (2009). Accord<strong>in</strong>g to this scenario by 2014 the TFR would be 5.7. Low scenario: 6.8<br />
(2004), 6.7 (2005), 6.6 (2006), 6.4 (2007), 6.2 (2008), 6.0 (2009). Accord<strong>in</strong>g to the low scenario by<br />
2011 the TFR would be 5.6.<br />
25