O Estado das Florestas na Europa - ICP Forests
O Estado das Florestas na Europa - ICP Forests
O Estado das Florestas na Europa - ICP Forests

You also want an ePaper? Increase the reach of your titles
YUMPU automatically turns print PDFs into web optimized ePapers that Google loves.
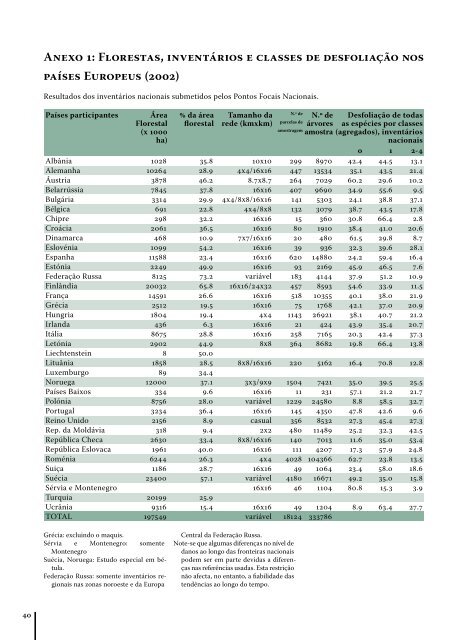
ANEXO 1: FLORESTAS, INVENTÁRIOS E CLASSES DE DESFOLIAÇÃO NOS<br />
PAÍSES EUROPEUS (2002)<br />
Resultados dos inventários <strong>na</strong>cio<strong>na</strong>is submetidos pelos Pontos Focais Nacio<strong>na</strong>is.<br />
Países participantes<br />
Área<br />
Florestal<br />
(x 1000<br />
ha)<br />
% da área<br />
florestal<br />
Tamanho da<br />
rede (kmxkm)<br />
N.º de<br />
parcelas de<br />
amostragem<br />
N.º de<br />
árvores<br />
Desfoliação de to<strong>das</strong><br />
as espécies por classes<br />
amostra (agregados), inventários<br />
<strong>na</strong>cio<strong>na</strong>is<br />
0 1 2-4<br />
Albânia 1028 35.8 10x10 299 8970 42.4 44.5 13.1<br />
Alemanha 10264 28.9 4x4/16x16 447 13534 35.1 43.5 21.4<br />
Áustria 3878 46.2 8.7x8.7 264 7029 60.2 29.6 10.2<br />
Belarrússia 7845 37.8 16x16 407 9690 34.9 55.6 9.5<br />
Bulgária 3314 29.9 4x4/8x8/16x16 141 5303 24.1 38.8 37.1<br />
Bélgica 691 22.8 4x4/8x8 132 3079 38.7 43.5 17.8<br />
Chipre 298 32.2 16x16 15 360 30.8 66.4 2.8<br />
Croácia 2061 36.5 16x16 80 1910 38.4 41.0 20.6<br />
Di<strong>na</strong>marca 468 10.9 7x7/16x16 20 480 61.5 29.8 8.7<br />
Eslovénia 1099 54.2 16x16 39 936 32.3 39.6 28.1<br />
Espanha 11588 23.4 16x16 620 14880 24.2 59.4 16.4<br />
Estónia 2249 49.9 16x16 93 2169 45.9 46.5 7.6<br />
Federação Russa 8125 73.2 variável 183 4144 37.9 51.2 10.9<br />
Finlândia 20032 65.8 16x16/24x32 457 8593 54.6 33.9 11.5<br />
França 14591 26.6 16x16 518 10355 40.1 38.0 21.9<br />
Grécia 2512 19.5 16x16 75 1768 42.1 37.0 20.9<br />
Hungria 1804 19.4 4x4 1143 26921 38.1 40.7 21.2<br />
Irlanda 436 6.3 16x16 21 424 43.9 35.4 20.7<br />
Itália 8675 28.8 16x16 258 7165 20.3 42.4 37.3<br />
Letónia 2902 44.9 8x8 364 8682 19.8 66.4 13.8<br />
Liechtenstein 8 50.0<br />
Lituânia 1858 28.5 8x8/16x16 220 5162 16.4 70.8 12.8<br />
Luxemburgo 89 34.4<br />
Noruega 12000 37.1 3x3/9x9 1504 7421 35.0 39.5 25.5<br />
Países Baixos 334 9.6 16x16 11 231 57.1 21.2 21.7<br />
Polónia 8756 28.0 variável 1229 24580 8.8 58.5 32.7<br />
Portugal 3234 36.4 16x16 145 4350 47.8 42.6 9.6<br />
Reino Unido 2156 8.9 casual 356 8532 27.3 45.4 27.3<br />
Rep. da Moldávia 318 9.4 2x2 480 11489 25.2 32.3 42.5<br />
República Checa 2630 33.4 8x8/16x16 140 7013 11.6 35.0 53.4<br />
República Eslovaca 1961 40.0 16x16 111 4207 17.3 57.9 24.8<br />
Roménia 6244 26.3 4x4 4028 104366 62.7 23.8 13.5<br />
Suiça 1186 28.7 16x16 49 1064 23.4 58.0 18.6<br />
Suécia 23400 57.1 variável 4180 16671 49.2 35.0 15.8<br />
Sérvia e Montenegro 16x16 46 1104 80.8 15.3 3.9<br />
Turquia 20199 25.9<br />
Ucrânia 9316 15.4 16x16 49 1204 8.9 63.4 27.7<br />
TOTAL 197549 variável 18124 333786<br />
Grécia: excluindo o maquis.<br />
Sérvia e Montenegro: somente<br />
Montenegro<br />
Suécia, Noruega: Estudo especial em bétula.<br />
Federação Russa: somente inventários regio<strong>na</strong>is<br />
<strong>na</strong>s zo<strong>na</strong>s noroeste e da <strong>Europa</strong><br />
Central da Federação Russa.<br />
Note-se que algumas diferenças no nível de<br />
danos ao longo <strong>das</strong> fronteiras <strong>na</strong>cio<strong>na</strong>is<br />
podem ser em parte devi<strong>das</strong> a diferenças<br />
<strong>na</strong>s referências usa<strong>das</strong>. Esta restrição<br />
não afecta, no entanto, a fiabilidade <strong>das</strong><br />
tendências ao longo do tempo.<br />
40