2011 - REN
2011 - REN
2011 - REN

You also want an ePaper? Increase the reach of your titles
YUMPU automatically turns print PDFs into web optimized ePapers that Google loves.
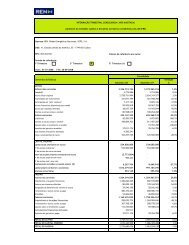
A dívida líquida aumentou 200M€<br />
DÍVIDA LÍQUIDA<br />
(M€)<br />
+201<br />
(+8,7%)<br />
2.311<br />
-515<br />
333<br />
143<br />
84<br />
38<br />
131<br />
-13<br />
2.512<br />
Dez<br />
<strong>2011</strong><br />
Cash Flow<br />
Operacional<br />
Capex<br />
(pagamentos)<br />
Juros<br />
(líquidos)<br />
Dividendos<br />
(recebidos<br />
-pagos)<br />
Investimentos<br />
Financeiros<br />
(HCB)<br />
Desvio de<br />
tarifas<br />
Outros<br />
Dez 2012<br />
O custo médio da dívida atingiu 5,70% (4,72% em <strong>2011</strong>);<br />
Métricas de crédito: o FFO / Dívida Líquida melhorou vs <strong>2011</strong> (13,3% em 2012 vs 11,6% em <strong>2011</strong>),<br />
enquanto o rácio Dívida Líquida / EBITDA se manteve estável (4,88x em 2012 vs 4,89x em <strong>2011</strong>). O FFO<br />
interest coverage recuou para 3,35x, face aos 3,52x de <strong>2011</strong>.<br />
Cash flow operacional = Resultado operacional + Amortizações + Provisões<br />
HCB = Hidroeléctrica de Cahora Bassa<br />
12