Catálogo - Vernier Software & Technology
Confira o novo Catálogo de Produtos da "Vernier Software & Technology" e se encante com os diversos produtos e soluções de Inovação e Tecnologia no Ensino de Ciências. São centenas de itens incluindo sensores, interfaces, kits didáticos, softwares a aplicativos que darão um UPGRADE no ensino de ciências (Física, Química, Biologia, Matemática, etc) de sua Escola ou Universidade. Confira o catálogo e solicite orçamentos através do site: www.hiperlab.com.br ou através do e-mail: hiperlab@hiperlab.com.br
Confira o novo Catálogo de Produtos da "Vernier Software & Technology" e se encante com os diversos produtos e soluções de Inovação e Tecnologia no Ensino de Ciências.
São centenas de itens incluindo sensores, interfaces, kits didáticos, softwares a aplicativos que darão um UPGRADE no ensino de ciências (Física, Química, Biologia, Matemática, etc) de sua Escola ou Universidade.
Confira o catálogo e solicite orçamentos através do site: www.hiperlab.com.br ou através do e-mail: hiperlab@hiperlab.com.br

Create successful ePaper yourself
Turn your PDF publications into a flip-book with our unique Google optimized e-Paper software.
Graphical Analysis 4<br />
Key Features<br />
Data Collection<br />
• Collect data from multiple sensors simultaneously,<br />
either with a multiple-channel interface such as<br />
LabQuest Stream or by using multiple Go Direct<br />
sensors. Use Data Sharing to retrieve data from just<br />
about every <strong>Vernier</strong> sensor.<br />
• Select time-based or event-based data collection,<br />
including events with entry.<br />
• Adjust data-collection rate and duration as needed.<br />
• Trigger time-based data collection on sensor values.<br />
• Calibrate sensors, although most of the time this is<br />
not needed.<br />
• Enter data manually or using the clipboard.<br />
• Change display units on many sensors.<br />
Data Analysis<br />
• Display one, two, or three graphs as needed.<br />
• Set the graph scale.<br />
• Select what is graphed on each axis, and select line- or<br />
point-style graphs.<br />
• Calculate descriptive statistics on all or some of<br />
your data.<br />
• Fit lines and curves to some or all of your data.<br />
• Define calculated columns based on sensor columns.<br />
Use this to linearize a graph, for example.<br />
• View data in a table.<br />
• Highlight and read values from a graph.<br />
• Interpolate and extrapolate using graphed data.<br />
Data Sharing<br />
• Receive data shared from LabQuest 2 or a computer<br />
running Logger Pro to support 1:1 lab groups.<br />
Data Storage<br />
• Store and retrieve previously shared data-collection<br />
and analysis sessions.<br />
• Save Graphical Analysis 4 software data files with<br />
analysis for use in Logger Pro 3.<br />
SOFTWARE GRAPHICAL ANALYSIS 4<br />
• Draw predictions before data collection.<br />
• Perform graph matching exercises with a<br />
Motion Detector.<br />
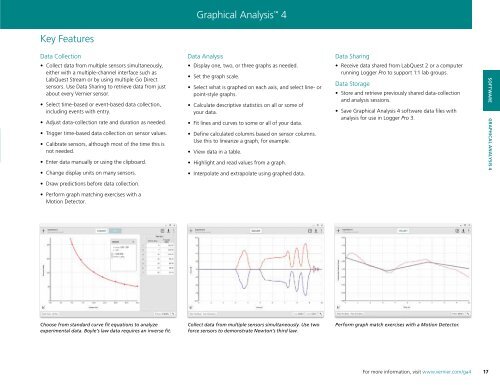
Choose from standard curve fit equations to analyze<br />
experimental data. Boyle’s law data requires an inverse fit.<br />
Collect data from multiple sensors simultaneously. Use two<br />
force sensors to demonstrate Newton’s third law.<br />
Perform graph match exercises with a Motion Detector.<br />
For more information, visit www.vernier.com/ga4<br />
17