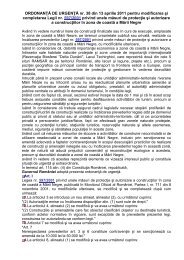
RO0023 <strong>Revizuirea</strong> <strong>Planului</strong> <strong>Naţional</strong> <strong>de</strong> <strong>Gestionare</strong> a <strong>Deşeurilor</strong> OPTIUNEA 2 100.80% 100.80% 100.80% 100.80% 100.80% 100.80% 100.80% 100.80% 100.80% Crestere 0.8% 0.8% 0.8% 0.8% 0.8% 0.8% 0.8% 0.8% 0.8% 2006 2007 2008 2009 2010 2011 2012 2013 2014 2015 1. Deseuri menajere si asimilabile - Total 5,362,443 5,405,343 5,448,585 5,492,174 5,536,111 5,580,400 5,625,043 5,670,044 5,715,404 5,761,127 1.1. Deseuri menajere <strong>de</strong> la populatie, in amestec 3,525,194 1.2. Deseuri menajere si asimilabile din unitati economice, comert, institutii, unitati sanitare 1,752,368 1.3. Deseuri menajere colectate separat (cu exceptia <strong>de</strong>seurilor din constructii si <strong>de</strong>molari) - total 48,108 371,166 699,390 1,032,842 1,371,584 1,715,680 2,065,193 2,420,190 2,780,734 3,146,891 <strong>de</strong>pozitat 4,997,109 4,711,832 4,421,670 4,126,564 3,826,453 3,521,276 3,210,972 2,895,477 2,574,729 1.4. Deseuri voluminoase colectate separat 36,773 37,067 37,364 37,663 37,964 38,268 38,574 38,882 39,193 39,507 2. . Deseuri din servicii municipale - Total 972,048 979,824 987,663 995,564 1,003,529 1,011,557 1,019,649 1,027,807 1,036,029 1,044,317 2.1. Deseuri <strong>de</strong> la curatenia strazilor 735,090 2.2. Deseuri din piete 99,734 2.3. Deseuri din parcuri si gradini 137,224 Reciclat 38,104 76,818 116,149 156,104 196,692 237,918 279,792 322,320 365,511 <strong>de</strong>pozitat 972,048 941,720 910,845 879,415 847,424 814,865 781,731 748,015 713,709 678,806 3. Deseuri provenite din activităţile <strong>de</strong> construire şi <strong>de</strong>sfiinţare 474,346 478,141 481,966 485,822 489,708 493,626 497,575 501,555 505,568 509,612 Reciclat 29,220 58,907 89,067 119,706 150,830 182,444 214,554 247,167 280,287 <strong>de</strong>pozitat 474,346 448,921 423,059 396,754 370,002 342,796 315,131 287,001 258,401 229,326 Total <strong>de</strong>seuri municipale colectate 6,808,837 6,863,308 6,918,214 6,973,560 7,029,348 7,085,583 7,142,268 7,199,406 7,257,001 7,315,057 Deseuri necolectate 2,057,587 2,074,048 2,090,640 2,107,365 2,124,224 2,141,218 2,158,348 2,175,614 2,193,019 2,210,564 necolectat 2,057,587 1,970,345 1,881,576 1,685,892 1,062,112 642,365 431,670 435,123 438,604 442,113 <strong>de</strong> colectat 103,702 209,064 421,473 1,062,112 1,498,853 1,726,678 1,740,492 1,754,415 1,768,451 reciclat 6,337 25,552 77,270 259,627 457,983 633,115 744,544 857,714 972,648 <strong>de</strong>pozitat 97,365 183,512 344,203 802,485 1,040,870 1,093,563 995,948 896,701 795,803 Total <strong>de</strong>seuri municipale generate 8,866,424 8,937,355 9,008,854 9,080,925 9,153,572 9,226,801 9,300,615 9,375,020 9,450,021 9,525,621 Deseuri menajere reciclate si compostate (%) 1.0% 5.39% 9.97% 14.90% 21.25% 27.74% 33.95% 39.44% 44.94% 50.44% 4,804,844 Prognoza % din <strong>de</strong>seurile menajere voluminoase 0.69% 0.69% 0.69% 0.69% 0.69% 0.69% 0.69% 0.69% 0.69% 0.69% Deseuri colectabile 0% 5% 10% 20% 50% 70% 80% 80% 80% 80% Deseuri menajere reciclate si compostate 0.90% 6.9% 12.9% 18.9% 24.9% 31.0% 37.0% 43.0% 49.0% 55% 0.0% 0.0% 0.0% 0.0% 0.0% 0.0% 0.0% 0.0% Deseuri reciclate din constructii si <strong>de</strong>molari 0% 6.1% 12.2% 18.3% 24.4% 30.6% 36.7% 42.8% 48.9% 55% Deseuri necolectate (dar colectabile) reciclabile si compostabile 0.00% 6.1% 12.2% 18.3% 24.4% 30.6% 36.7% 42.8% 48.9% 55% Deseuri din servicii municipale reciclate si compostate 0.00% 3.9% 7.8% 11.7% 15.6% 19.4% 23.3% 27.2% 31.1% 35% AEA Mediu Consulting srl / AEA Technology plc 166
RO0023 <strong>Revizuirea</strong> <strong>Planului</strong> <strong>Naţional</strong> <strong>de</strong> <strong>Gestionare</strong> a <strong>Deşeurilor</strong> Sumar AEA Mediu Consulting srl / AEA Technology plc 167