

日 本 の 地 域 別 将 来 推 計 人 口
日 本 の 地 域 別 将 来 推 計 人 口
日 本 の 地 域 別 将 来 推 計 人 口
- TAGS
- output

Create successful ePaper yourself
Turn your PDF publications into a flip-book with our unique Google optimized e-Paper software.
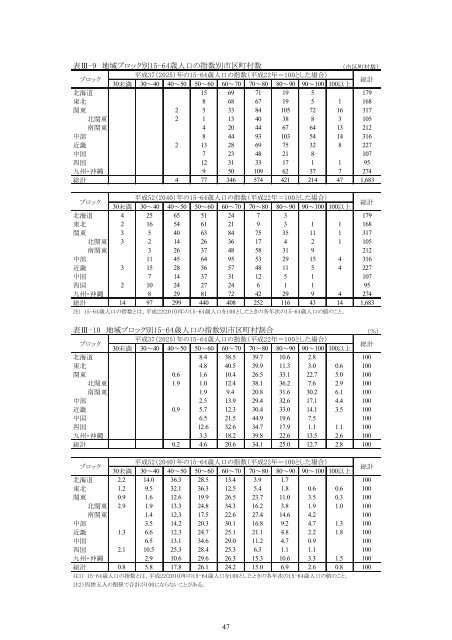
表Ⅲ-9 <strong>地</strong><strong>域</strong>ブロック<strong>別</strong>15-64歳<strong>人</strong><strong>口</strong><strong>の</strong>指数<strong>別</strong>市区町村数 (市区町村数)<br />
ブロック<br />
平成37(2025)年<strong>の</strong>15-64歳<strong>人</strong><strong>口</strong><strong>の</strong>指数(平成22年=100とした場合)<br />
30未満 30~40 40~50 50~60 60~70 70~80 80~90 90~100 100以上<br />
総<strong>計</strong><br />
北海道 15 69 71 19 5 179<br />
東北 8 68 67 19 5 1 168<br />
関東 2 5 33 84 105 72 16 317<br />
北関東 2 1 13 40 38 8 3 105<br />
南関東 4 20 44 67 64 13 212<br />
中部 8 44 93 103 54 14 316<br />
近畿 2 13 28 69 75 32 8 227<br />
中国 7 23 48 21 8 107<br />
四国 12 31 33 17 1 1 95<br />
九州・沖縄 9 50 109 62 37 7 274<br />
総<strong>計</strong> 4 77 346 574 421 214 47 1,683<br />
ブロック<br />
平成52(2040)年<strong>の</strong>15-64歳<strong>人</strong><strong>口</strong><strong>の</strong>指数(平成22年=100とした場合)<br />
30未満 30~40 40~50 50~60 60~70 70~80 80~90 90~100 100以上<br />
総<strong>計</strong><br />
北海道 4 25 65 51 24 7 3 179<br />
東北 2 16 54 61 21 9 3 1 1 168<br />
関東 3 5 40 63 84 75 35 11 1 317<br />
北関東 3 2 14 26 36 17 4 2 1 105<br />
南関東 3 26 37 48 58 31 9 212<br />
中部 11 45 64 95 53 29 15 4 316<br />
近畿 3 15 28 56 57 48 11 5 4 227<br />
中国 7 14 37 31 12 5 1 107<br />
四国 2 10 24 27 24 6 1 1 95<br />
九州・沖縄 8 29 81 72 42 29 9 4 274<br />
総<strong>計</strong> 14 97 299 440 408 252 116 43 14 1,683<br />
注) 15-64歳<strong>人</strong><strong>口</strong><strong>の</strong>指数とは、平成22(2010)年<strong>の</strong>15-64歳<strong>人</strong><strong>口</strong>を100としたとき<strong>の</strong>各年次<strong>の</strong>15-64歳<strong>人</strong><strong>口</strong><strong>の</strong>値<strong>の</strong>こと。<br />
表Ⅲ-10 <strong>地</strong><strong>域</strong>ブロック<strong>別</strong>15-64歳<strong>人</strong><strong>口</strong><strong>の</strong>指数<strong>別</strong>市区町村割合 (%)<br />
ブロック<br />
平成37(2025)年<strong>の</strong>15-64歳<strong>人</strong><strong>口</strong><strong>の</strong>指数(平成22年=100とした場合)<br />
30未満 30~40 40~50 50~60 60~70 70~80 80~90 90~100 100以上<br />
総<strong>計</strong><br />
北海道 8.4 38.5 39.7 10.6 2.8 100<br />
東北 4.8 40.5 39.9 11.3 3.0 0.6 100<br />
関東 0.6 1.6 10.4 26.5 33.1 22.7 5.0 100<br />
北関東 1.9 1.0 12.4 38.1 36.2 7.6 2.9 100<br />
南関東 1.9 9.4 20.8 31.6 30.2 6.1 100<br />
中部 2.5 13.9 29.4 32.6 17.1 4.4 100<br />
近畿 0.9 5.7 12.3 30.4 33.0 14.1 3.5 100<br />
中国 6.5 21.5 44.9 19.6 7.5 100<br />
四国 12.6 32.6 34.7 17.9 1.1 1.1 100<br />
九州・沖縄 3.3 18.2 39.8 22.6 13.5 2.6 100<br />
総<strong>計</strong> 0.2 4.6 20.6 34.1 25.0 12.7 2.8 100<br />
ブロック<br />
平成52(2040)年<strong>の</strong>15-64歳<strong>人</strong><strong>口</strong><strong>の</strong>指数(平成22年=100とした場合)<br />
30未満 30~40 40~50 50~60 60~70 70~80 80~90 90~100 100以上<br />
総<strong>計</strong><br />
北海道 2.2 14.0 36.3 28.5 13.4 3.9 1.7 100<br />
東北 1.2 9.5 32.1 36.3 12.5 5.4 1.8 0.6 0.6 100<br />
関東 0.9 1.6 12.6 19.9 26.5 23.7 11.0 3.5 0.3 100<br />
北関東 2.9 1.9 13.3 24.8 34.3 16.2 3.8 1.9 1.0 100<br />
南関東 1.4 12.3 17.5 22.6 27.4 14.6 4.2 100<br />
中部 3.5 14.2 20.3 30.1 16.8 9.2 4.7 1.3 100<br />
近畿 1.3 6.6 12.3 24.7 25.1 21.1 4.8 2.2 1.8 100<br />
中国 6.5 13.1 34.6 29.0 11.2 4.7 0.9 100<br />
四国 2.1 10.5 25.3 28.4 25.3 6.3 1.1 1.1 100<br />
九州・沖縄 2.9 10.6 29.6 26.3 15.3 10.6 3.3 1.5 100<br />
総<strong>計</strong> 0.8 5.8 17.8 26.1 24.2 15.0 6.9 2.6 0.8 100<br />
注1) 15-64歳<strong>人</strong><strong>口</strong><strong>の</strong>指数とは、平成22(2010)年<strong>の</strong>15-64歳<strong>人</strong><strong>口</strong>を100としたとき<strong>の</strong>各年次<strong>の</strong>15-64歳<strong>人</strong><strong>口</strong><strong>の</strong>値<strong>の</strong>こと。<br />
注2)四捨五入<strong>の</strong>関係で合<strong>計</strong>が100にならないことがある。<br />
47