SCOTTISH ANTI POVERTY REVIEW
SAPRNo22_FINAL_web
SAPRNo22_FINAL_web
You also want an ePaper? Increase the reach of your titles
YUMPU automatically turns print PDFs into web optimized ePapers that Google loves.
<strong>SCOTTISH</strong> <strong>ANTI</strong> <strong>POVERTY</strong> <strong>REVIEW</strong> AUTUMN 2016<br />
During the five negative income tax experiments in the<br />
United States and Canada in the 1960s and 1970s labour<br />
supply declined moderately, but these results cannot be<br />
translated directly into the context of Finland in the 2010s.<br />
The experiments had also methodological weaknesses<br />
which had effects on the reported results. It is also<br />
necessary to mention that in the light of social exclusion<br />
these results were not as negative as it might look at first<br />
sight since young people educated themselves further and<br />
mothers looked after their children instead of working.<br />
In addition to employment there are naturally many<br />
other indicators which might indicate social inclusion<br />
or exclusion and on which basic income may have<br />
direct or indirect effect. For instance health, educational<br />
attainment, subjective well-being, stigmatisation of social<br />
security, housing, and indebtedness can be evaluated, but<br />
ex ante research on these indicators is highly speculative.<br />
According to a study by Evelyn Forget negative income tax<br />
had considerable positive effects on health, and especially<br />
mental health, during and even after an experiment which<br />
was carried out in Dauphin Manitoba in 1974–1979.<br />
It has naturally argued that an unconditional basic income<br />
might also increase social exclusion. Since basic income<br />
is unconditional by definition, it would make current<br />
activation measures voluntary and people could refuse<br />
to participate both in labour markets or the activation<br />
measures offered without a threat of sanctions. Many<br />
commentators have been particularly worried about<br />
youths. Partly due to the possibly increasing risk of social<br />
exclusion of NEETs (not in education, employment or<br />
training), the research group recommended to exclude<br />
youth under 25 years old from the Finnish basic income<br />
experiment.<br />
To tackle moral connotations and speculations, we<br />
concentrate next on the direct effects of a basic income on<br />
social exclusion. The indicators which we can analyse ex<br />
ante and which we consider meaningful in this context are<br />
poverty and income distribution.<br />
The negative effects of poverty and asymmetric income<br />
distribution on social exclusion indicators such as health,<br />
nourishment and social cohesion have been widely<br />
discussed in research literature.<br />
The effects of different basic income models on poverty<br />
and income distribution<br />
The research group made extensive calculations and<br />
simulations with different basic income models, especially<br />
with different levels of partial basic income which<br />
replace basic benefits while earnings related benefits<br />
are adjusted with the basic income. One example: if the<br />
agreed basic income is 600 euros per month, it replaces<br />
basic unemployment benefits, sickness benefits, maternity<br />
benefits, child care benefits and study grants if these are<br />
less or equal than 600 euros per month. Earnings related<br />
benefits in unemployment and sickness insurance are<br />
in most cases greater than 600 euros. In hypothetical<br />
models these benefits are adjusted so that the gross<br />
benefit, including basic income, does not diminish. E.g.<br />
if originally the earnings related benefit is 1000 euros per<br />
month, the person gets in the basic income model 600<br />
euros of basic income and still 400 euros of an earnings<br />
related benefit. In these calculations housing benefits and<br />
social assistance are paid according to the current rules. In<br />
general basic income lowers the demand for these meanstested<br />
benefits, but it does not totally eliminate them.<br />
When basic income is paid for the whole population, it<br />
cannot be financed only by the benefit expenditures it<br />
is replacing. A big reform must be carried through also<br />
in the tax system. In the hypothetical simulations the<br />
research group implemented a flat tax rate on all taxable<br />
income (labour income, benefit incomes and capital<br />
income; basic income itself excluded from the tax base).<br />
This flat tax replaces all current income taxes and with the<br />
help of the simulation model a budget neutral tax rate is<br />
sought for. Also tax systems which modified the current<br />
system were experimented, because a general flat tax is not<br />
realistic, and not even a desirable alternative in the Finnish<br />
context.<br />
In the simulation experiments the basic income was paid<br />
for the adult population (age at least 18 years) excluding<br />
individuals having pension income. Pensioners were<br />
excluded because the current pension system has already<br />
many features corresponding to a basic income. So there<br />
is a universal, non-means tested minimum pension level<br />
(so called guarantee pension) and old-age pensions are<br />
not means-tested against labour income. The pensioners<br />
are nevertheless still included in the figures describing the<br />
income distribution of the whole population.<br />
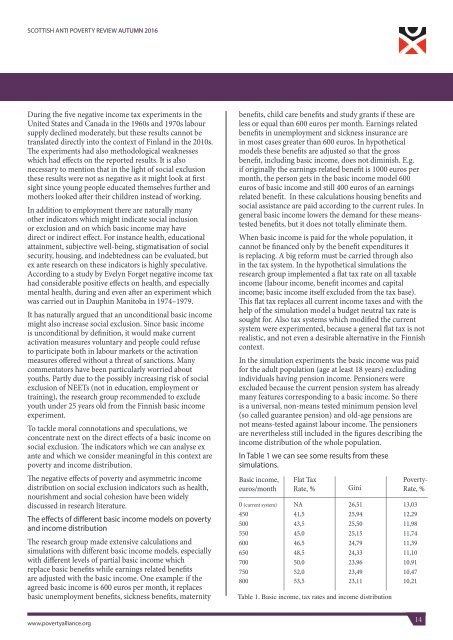
In Table 1 we can see some results from these<br />
simulations.<br />
Basic income,<br />
euros/month<br />
Flat Tax<br />
Rate, %<br />
Gini<br />
0 (current system) NA 26,51 13,03<br />
450 41,5 25,94 12,29<br />
500 43,5 25,50 11,98<br />
550 45,0 25,15 11,74<br />
600 46,5 24,79 11,39<br />
650 48,5 24,33 11,10<br />
700 50,0 23,96 10,91<br />
750 52,0 23,49 10,47<br />
800 53,5 23,11 10,21<br />
Table 1. Basic income, tax rates and income distribution<br />
Poverty-<br />
Rate, %<br />
www.povertyalliance.org<br />
14


