
Create successful ePaper yourself
Turn your PDF publications into a flip-book with our unique Google optimized e-Paper software.
<strong>Aroma</strong> Group<br />
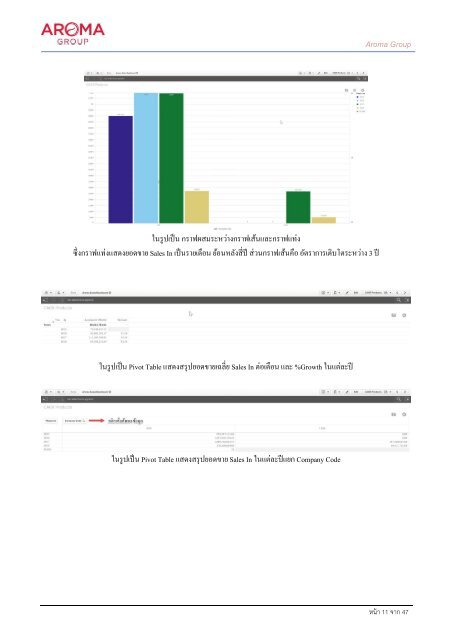
ในรูปเป็ น กราฟผสมระหว่างกราฟเส้นและกราฟแท่ง<br />
ซึ ่งกราฟแท่งแสดงยอดขาย <strong>Sales</strong> In เป็ นรายเดือน ย้อนหลังสี่ปี ส่วนกราฟเส้นคือ อัตราการเติบโตระหว่าง 3 ปี<br />
ในรูปเป็ น Pivot Table แสดงสรุปยอดขายเฉลี่ย <strong>Sales</strong> In ต่อเดือน และ %Growth ในแต่ละปี<br />
ในรูปเป็ น Pivot Table แสดงสรุปยอดขาย <strong>Sales</strong> In ในแต่ละปี แยก Company Code<br />
หน้า 11 จาก 47