x - Rose-Hulman
x - Rose-Hulman
x - Rose-Hulman

Create successful ePaper yourself
Turn your PDF publications into a flip-book with our unique Google optimized e-Paper software.
RHIT / Department of Humanities & Social Sciences / K. Christ<br />
Spring 2010 – 2011 / IA 350, Intermediate Microeconomics / Problem Set 1<br />
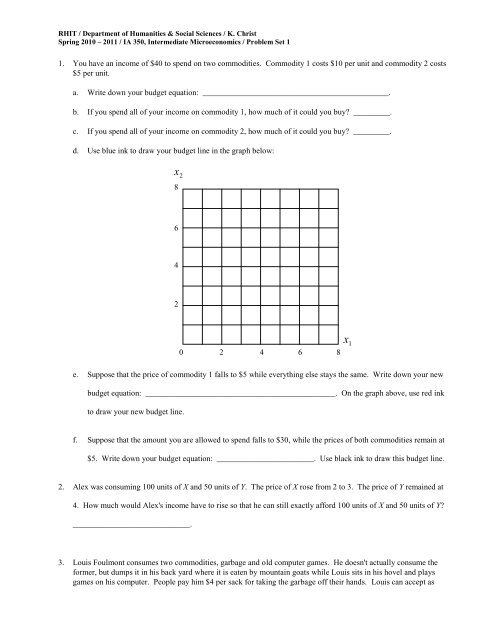
1. You have an income of $40 to spend on two commodities. Commodity 1 costs $10 per unit and commodity 2 costs<br />
$5 per unit.<br />
a. Write down your budget equation: ______________________________________________.<br />
b. If you spend all of your income on commodity 1, how much of it could you buy? _________.<br />
c. If you spend all of your income on commodity 2, how much of it could you buy? _________.<br />
d. Use blue ink to draw your budget line in the graph below:<br />
x 2<br />
8<br />
6<br />
4<br />
2<br />
x 1<br />
0 2 4 6 8<br />
e. Suppose that the price of commodity 1 falls to $5 while everything else stays the same. Write down your new<br />
budget equation: _______________________________________________. On the graph above, use red ink<br />
to draw your new budget line.<br />
f. Suppose that the amount you are allowed to spend falls to $30, while the prices of both commodities remain at<br />
$5. Write down your budget equation: ________________________. Use black ink to draw this budget line.<br />
2. Alex was consuming 100 units of X and 50 units of Y. The price of X rose from 2 to 3. The price of Y remained at<br />
4. How much would Alex's income have to rise so that he can still exactly afford 100 units of X and 50 units of Y?<br />
_____________________________.<br />
3. Louis Foulmont consumes two commodities, garbage and old computer games. He doesn't actually consume the<br />
former, but dumps it in his back yard where it is eaten by mountain goats while Louis sits in his hovel and plays<br />
games on his computer. People pay him $4 per sack for taking the garbage off their hands. Louis can accept as
RHIT / Department of Humanities & Social Sciences / K. Christ<br />
Spring 2010 – 2011 / IA 350, Intermediate Microeconomics / Problem Set 1<br />
much garbage as he wishes at that price, and has no other source of income. Old computer games cost him $12<br />
each.<br />
a. If Louis accepts zero sacks of garbage, how many computer games can he buy? __________.<br />
b. If Louis accepts 15 sacks of garbage, how many computer games can he buy? ___________.<br />
c. Write down an equation for his budget constraint: __________________________________.<br />
d. Draw his budget line and shade in his feasible budget set.<br />
Garbage<br />
20<br />
15<br />
10<br />
5<br />
0 5 10 15 20<br />
Computer<br />
Games<br />
4. Coach Steroid likes his football players to be big, fast, and obedient. If player A is better than player B in two of<br />
these three characteristics, then he prefers A to B. Otherwise, he is indifferent between them. Casey Christopher<br />
weighs 340 pounds, runs very slowly, and is fairly obedient. Kenny Kim weighs 240 pounds, runs very fast, and<br />
very rarely follows instructions. Bobby Bremmer weighs 150 pounds, has average running speed, and is extremely<br />
obedient.<br />
a. Given a choice between Christopher and Kim, who does Coach Steroid prefer? ____________.<br />
b. Given a choice between Kim and Bremmer, who does Coach Steroid prefer? ____________.<br />
c. Given a choice between Christopher and Bremmer, who does Coach Steroid prefer? __________.<br />
d. Does Coach Steroid have transitive preferences? __________.
RHIT / Department of Humanities & Social Sciences / K. Christ<br />
Spring 2010 – 2011 / IA 350, Intermediate Microeconomics / Problem Set 1<br />
5. Marcel consumes only nuts and berries. Both commodities are economic goods for Marcel. The set of<br />
consumption bundles (x 1 , x 2 ) such that Marcel is indifferent between (x 1 , x 2 ) and (1, 16) is the set of bundles such<br />
x<br />
2<br />
4<br />
20 x<br />
that x 1 , x 2 > 0 and<br />
1<br />
. The set of consumption bundles (x 1 , x 2 ) such that Marcel is indifferent<br />
between (x 1 , x 2 ) and (36, 0) is the set of bundles such that x 1 , x 2 > 0 and x2 24 4 x1<br />
.<br />
a. On the diagram below, plot several points that lie on the indifference curve that passes through the point<br />
(1, 16) and sketch this curve, using blue ink. Do the same, using red ink, for the indifference curve<br />
passing through the point (36, 0).<br />
b. Is the set of bundles that Marcel prefers to (1, 16) a convex set?<br />
c. What is the slope of Marcel's indifference curve at the point (9, 8)?<br />
d. What is the slope of Marcel's indifference curve at the point (4, 12)? _________.<br />
e. What is the slope of Marcel's indifference curve at the point (9, 12)? _________. What is the slope of<br />
Marcel's indifference curve at the point (4, 16)? __________.<br />
f. Do the indifference curves you have drawn exhibit diminishing marginal rate of substitution? _________.<br />
g. Does Marcel have convex preferences? __________.<br />
x 2<br />
40<br />
, Berries<br />
30<br />
20<br />
10<br />
0 10 20 30 40<br />
x 1<br />
, Nuts
RHIT / Department of Humanities & Social Sciences / K. Christ<br />
Spring 2010 – 2011 / IA 350, Intermediate Microeconomics / Problem Set 1<br />
6. Brittany Arrow likes to spend some time studying calculus and some time dating <strong>Rose</strong>-<strong>Hulman</strong> hunks. Her<br />
indifference curves between hours per week spent studying and hours per week spent dating are concentric<br />
circles around her favorite combination, which is 20 hours of studying and 15 hours of dating. The closer she<br />
is to her favorite combination, the happier she is.<br />
a. Suppose that Brittany is currently studying 25 hours per week and dating 3 hours per week. Would she<br />
prefer to be studying 30 hours per week and dating 8 hours per week? _________.<br />
b. On the diagram below, draw a few of Britanny's indifference curves, and then illustrate on the diagram<br />
which of the two time allocations discussed above Brittany would prefer.<br />
Dating<br />
40<br />
30<br />
20<br />
10<br />
0 10 20 30 40<br />
Studying<br />
7. For each of the following expressions, state the formal assumption that is being made about the individual utility<br />
function. You may find it helpful to illustrate your response with a diagram.<br />
a. Margarine is just as good as butter.<br />
b. Peanut butter and jelly go together like a horse and carriage.<br />
c. Things go better with Coke.<br />
d. Pringles: “Once you pop, you just can’t stop.”<br />
e. Double the bubbles are twice as nice.
RHIT / Department of Humanities & Social Sciences / K. Christ<br />
Spring 2010 – 2011 / IA 350, Intermediate Microeconomics / Problem Set 1<br />
8. Adrian's utility function is U(x, y) = (x + 2)(y + 1).<br />
a. Write an equation, y = f(x), for Adrian's indifference curve that goes through the point (x, y) = 2, 8).<br />
_________________________________. On the diagram below, sketch Adrian's indifference curve for U = 36.<br />
b. Suppose that the price of each good is 1 and that Adrian has an income of 11. Write out an expression for the<br />
budget constraint: ___________________________. Based on this information, add an appropriate budget<br />
line to the diagram. Can Adrian achieve U = 36 with this budget? ___________.<br />
c. Write out a mathematical expression for Adrian's marginal rate of substitution in terms of x and y:<br />
_____________________. (Remember,<br />
MRS<br />
MU<br />
x<br />
.)<br />
MU<br />
y<br />
d. Using this information, what is Adrian's optimal consumption bundle? x = _____; y = ______.<br />
16<br />
y<br />
12<br />
8<br />
4<br />
0 4 8 12 16<br />
x
RHIT / Department of Humanities & Social Sciences / K. Christ<br />
Spring 2010 – 2011 / IA 350, Intermediate Microeconomics / Problem Set 1<br />
9. Consider a consumer with the utility function U(x 1 , x 2 ) = (x 1 + 2)(x 2 + 10). Derive general demand expressions for<br />
x<br />
1<br />
and x<br />
2<br />
as functions of prices and income, m.<br />
10. If a consumer’s utility function is<br />
U <br />
x 3<br />
x 5<br />
1 2<br />
goods? _____________________________________________.<br />
, what proportion of her income will be spent on each of the two<br />
11. Consider the following utility function:<br />
( )<br />
a. Derive the indirect utility function.<br />
b. Derive demand functions for x and y (in terms of prices and income).<br />
c. What are the price elasticities of demand for goods x and y? For each good, is demand elastic, unit elastic, or<br />
inelastic?<br />
12. Suppose that an individual’s utility function is<br />
U .<br />
x 2<br />
x 8<br />
1 2<br />
a. Write an expression for this individual’s marginal rate of substitution: ___________________.<br />
b. Making use of your result in part (a) and of the general formulation of the budget equation (<br />
p x1<br />
p2x2<br />
1<br />
m ), derive a general statement for this individual’s demand for good x<br />
1<br />
as a function of<br />
prices and income. ____________________________________________________.<br />
c. Now, if p 1<br />
2 , p 4 2<br />
, and 240<br />
m , how much of good x<br />
1<br />
will the individual demand and what<br />
portion of his income will he spend on it? __________________________.
RHIT / Department of Humanities & Social Sciences / K. Christ<br />
Spring 2010 – 2011 / IA 350, Intermediate Microeconomics / Problem Set 1<br />
d If p1<br />
doubles (to 4), p<br />
2<br />
increases by 50% (to 6), and income remains unchanged, how much of good x<br />
1<br />
will<br />
the individual demand and what portion of his income will he spend on it? ___________________________.<br />
e. Compare the portion of income spent on good x1<br />
in parts (c) and (d). How could you have predicted this result<br />
before you even began calculating demand functions?<br />
13. Suppose that Phil likes to consume only apples and oranges. He has $3.00 per week to spend on these goods, the<br />
price of apples is $0.20 each, and the most oranges he could consume is 10.<br />
a. Write out Phil’s budget constraint and graph it on the diagram below. _____________________.<br />
b. Assume that Phil is indifferent between the following bundles, where the first number in parenthesis is a<br />
quantity of apples, while the second number is a quantity of oranges: (5,10); (7,6); (9,4); (12,3). Plot these<br />
bundles and draw Phil’s indifference curve. Are Phil’s preferences convex?<br />
c. What is Phil’s marginal rate of substitution at the bundle (9,4)? _________________.<br />
d. If someone offered Phil 2 oranges for 1 apple, would he accept the trade? _________________.<br />
Oranges<br />
Apples<br />
14. Suppose a consumer's utility function is given by U(x 1 , x 2 ) = x 1 x 2 , that p<br />
1<br />
=1, p<br />
2<br />
=2, and m = 40, and that p<br />
2<br />
suddenly falls to 1.<br />
a. Before the price change, this consumer will consume ______ units of x<br />
1<br />
and ______ units of x<br />
2<br />
. On the<br />
diagram below draw an indifference curve/budget diagram that illustrates this initial choice point, labeling the<br />
bundle that the consumer chooses under these conditions with the letter A.<br />
b. If, after the price change, the consumer's income had changed so that she could exactly afford her original<br />
consumption bundle, her new income would have to be __________. With this new income and at the new
RHIT / Department of Humanities & Social Sciences / K. Christ<br />
Spring 2010 – 2011 / IA 350, Intermediate Microeconomics / Problem Set 1<br />
prices, however, this consumer would consumer ______ units of x<br />
1<br />
and ______ units of x<br />
2<br />
. On the diagram<br />
below, use red ink to draw the budget line corresponding to this income and these prices. Label the bundle that<br />
the consumer chooses with the letter B.<br />
c. Does the substitution effect of the fall in p<br />
2<br />
cause the consumer to buy more or less of x<br />
2<br />
? _______. How<br />
much more or less? ______________________________________________.<br />
d. After the price change, the consumer actually buys ______ units of x<br />
1<br />
and ______ units of x<br />
2<br />
. Use blue ink<br />
to draw the actual budget line after the price change. Put the label C on the bundle that she actually chooses<br />
after the price change.<br />
e. Draw three horizontal lines on the diagram, one from point A to the vertical axis, one from B to the vertical<br />
axis, and one from C to the vertical axis. Along the vertical axis, label the income and substitution effects on<br />
the demand for x<br />
2<br />
.<br />
e. Draw three vertical lines on the diagram, one from point A to the horizontal axis, one from B to the horizontal<br />
axis, and one from C to the horizontal axis. Along the horizontal axis, label the income and substitution effects<br />
on the demand for x<br />
1.<br />
x 2<br />
40<br />
Diagram on next page.<br />
30<br />
20<br />
10<br />
0 10 20 30 40<br />
x 1<br />
15. A certain economist spends his free time consuming fine French wine. When the prices of all other goods are fixed<br />
at current levels, his demand function for rich, red bordeaux wine is q 0.<br />
005m<br />
2p<br />
, where m is his income, p<br />
is the price of the wine in dollars, and q is the number of bottles that he demands. His income is $30,000<br />
(obviously he is overpaid), and the dollar price of a bottle of suitable wine is $30.<br />
a. At his current level of income and with current prices, how many bottles will he demand? _________.<br />
b. If the depreciation of the dollar against the euro causes the dollar price of a bottle of bordeaux to rise to $50,<br />
what would his income need to be in order to be exactly able to afford the amount of bordeaux and the amount
RHIT / Department of Humanities & Social Sciences / K. Christ<br />
Spring 2010 – 2011 / IA 350, Intermediate Microeconomics / Problem Set 1<br />
of other goods that he bought before the price change? ____________. At this income and the price of $50,<br />
how many bottles would he demand? ______________.<br />
c. At his original income of $30,000 and a price of $50, how many bottles would he demand? _________.<br />
d. When the dollar price of bordeaux rises from $30 to $50, the number of bottles that this economist demanded<br />
decreased by _________. The substitution effect [increased, decreased] his demand by _________ bottles, and<br />
the income effect [increased, decreased] his demand by _________.<br />
16. Given U(x 1 , x 2 ) = x 1 x 2 2 and p 1 = 10, p 2 = 10, and m = 3,000 …<br />
a. Use this information and your knowledge of demand functions for Cobb-Douglass utility functions to calculate<br />
the total demand for x and y and the total expenditures on each good (p 1 x 1 and p 2 x 2 ). You do not need to<br />
show the derivation of the demand functions.<br />
b. Suppose the price of x 1 increases to 25. Calculate the new demands for x 1 and x 2 .<br />
c. Decompose the change in demand for x 1 due to this price change into a Slutsky substitution and income<br />
effect. In other words, calculate the portion of the total change in demand for x 1 that is attributable to a<br />
substitution effect and the portion of the total change in demand for x 1 that is attributable to an income<br />
effect. For full credit, show the steps in your work, including computation of m’, compensated income.<br />
d. Carefully and neatly construct a diagram illustrating your solution, indicating all key values along the<br />
horizontal and vertical axes.<br />
x 2<br />
x 1
RHIT / Department of Humanities & Social Sciences / K. Christ<br />
Spring 2010 – 2011 / IA 350, Intermediate Microeconomics / Problem Set 1<br />
17. Suppose that a new political party, The Pigovians, gains control of Congress and their first move is to<br />
impose a steep carbon tax on gasoline to encourage conservation and “do something about climate<br />
change.” For simplicity, assume that the new tax on gasoline causes the retail price to increase from<br />
$3 per gallon to $5 per gallon (yikes!). Now assume that a typical consumer with annual income of<br />
$40,000 and convex preferences consumes 1,200 gallons of gas before imposition of the tax 900<br />
gallons of gas after imposition of the tax.<br />
a. Carefully and neatly construct a diagram that illustrates this consumer's equilibrium before and<br />
after imposition of the tax. Specify equilibrium amounts (before and after the tax) on both axes.<br />
Your diagram need not be drawn to scale -- in fact it will be easier if you do not attempt to draw to<br />
scale along the vertical axis.<br />
Everything Else<br />
Gas<br />
b. It took a while for the Pigovians to figure out why everyone was so mad at them after the<br />
imposition of the tax. But then you showed them your diagram and explained it to them. What<br />
did you say?<br />
c. After talking with you, the Pigovians have a new idea: they will send everyone a rebate for the<br />
amount of new tax on gasoline they spent. Their argument is very simple: "We didn't want to<br />
make people worse off, we just wanted them to use less gas. So if we rebate the tax they pay,<br />
they'll be as well off as they were before the tax but will use less gasoline." Critics of this<br />
proposal argue that this tax and rebate plan will have no effect on gasoline demand since<br />
consumers will just use the rebated money to purchase more gasoline. What does economic<br />
analysis say about this?<br />
d. The Pigovians claim that their rebate plan will make everyone as well off as they were before the<br />
tax. Modify the diagram above to show the flaw in the Pigovian’s rebate logic and explain that<br />
flaw here. Specifically, add a new, post-rebate, budget constraint that illustrates the flaw in their<br />
rebate plan. (Hint: Think about how the rebate shifts the budget constraint.)
RHIT / Department of Humanities & Social Sciences / K. Christ<br />
Spring 2010 – 2011 / IA 350, Intermediate Microeconomics / Problem Set 1<br />
18. Madeline spends all of her income on pansies and petunias, which she regards as perfect substitutes.<br />
Pansies cost $4 per unit, and petunias cost $5 per unit.<br />
a. If the price of pansies decreases to $3 per unit, will Madeline buy more of them? _________.<br />
What part of this change in consumption is due to the income effect and what part is due to the<br />
substitution effect? ___________________________________________________________.<br />
b. If the price of pansies was $4, the price of petunias was $5, and Madeline's income for flowers is<br />
$120, draw her budget line in blue ink on the diagram below. Draw the highest indifference curve<br />
that she can attain in red ink, and label the point that she chooses as A.<br />
c. Now suppose that the price of petunias falls to $3 per unit while the price of pansies does not<br />
change. Draw her new budget line in black ink. Draw the highest indifference curve that she can<br />
now reach with red ink, and label her optimum choice point as B.<br />
d. How much would Madeline's income have to be after the price of petunias fell, so that she could<br />
just exactly afford her old commodity bundle at A? _____________________.<br />
e. When the price of petunias fell to $3, what part of the change in Madeline's demand was due to the<br />
income effect and what part was due to the substitution effect? ___________________________.<br />
Pansies<br />
40<br />
30<br />
20<br />
10<br />
0 10 20 30 40<br />
Petunias
RHIT / Department of Humanities & Social Sciences / K. Christ<br />
Spring 2010 – 2011 / IA 350, Intermediate Microeconomics / Problem Set 1<br />
19. Heidi receives utility from two goods, goat’s milk (M) and strudel (S), according to the utility function<br />
U(M,S) = M*S.<br />
a. Show that increases in the price of goat’s milk will not affect the quantity of strudel that Heidi<br />
buys – that is, show that ⁄ .<br />
b. Develop an intuitive argument that explains why the substitution and income effects of a change in<br />
P M are exactly offsetting in their effect on S in this utility function.<br />
20. Preferences and an extension:<br />
a. Show that Cobb-Douglas preferences are homothetic.<br />
b. Now consider the following data on consumer expenditure shares by income level and expenditure<br />
category and comment upon whether you think homothetic preferences are a reasonable<br />
assumption for modeling U.S. consumer preferences.<br />
Income Range: Less than $100,000 $100,000 to $149,000 More than $150,000<br />
Total Expenditures $ 51,607 $ 81,026 $ 118,674<br />
Food $ 6,669 12.9% $ 9,202 11.4% $ 11,435 9.6%<br />
Housing $ 15,795 30.6% $ 24,962 30.8% $ 36,971 31.2%<br />
Transportation $ 10,324 20.0% $ 14,982 18.5% $ 16,799 14.2%<br />
Health care $ 2,745 5.3% $ 3,472 4.3% $ 4,447 3.7%<br />
Other $ 16,074 31.1% $ 28,410 35.1% $ 49,022 41.3%<br />
Source: Statistical Abstract of the U.S., 2006, Table 666.