

Who Benefits?
fnkI300qtdZ
fnkI300qtdZ

You also want an ePaper? Increase the reach of your titles
YUMPU automatically turns print PDFs into web optimized ePapers that Google loves.
<strong>Who</strong> <strong>Benefits</strong>?<br />
A Summary of the Economic Impacts That Result From the Trans Mountain Expansion Project<br />
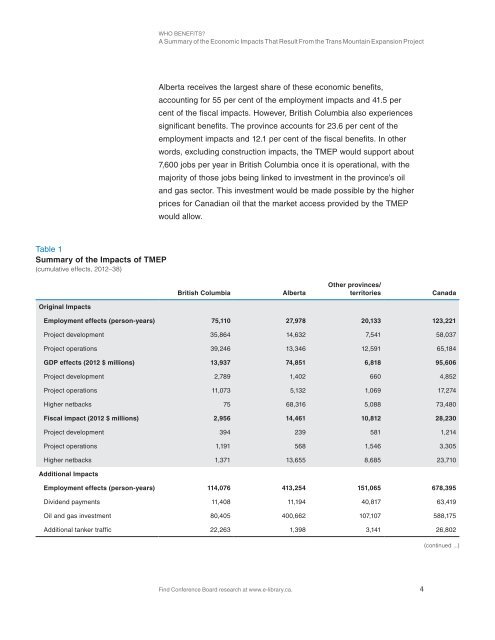
Alberta receives the largest share of these economic benefits,<br />
accounting for 55 per cent of the employment impacts and 41.5 per<br />
cent of the fiscal impacts. However, British Columbia also experiences<br />
significant benefits. The province accounts for 23.6 per cent of the<br />
employment impacts and 12.1 per cent of the fiscal benefits. In other<br />
words, excluding construction impacts, the TMEP would support about<br />
7,600 jobs per year in British Columbia once it is operational, with the<br />
majority of those jobs being linked to investment in the province’s oil<br />
and gas sector. This investment would be made possible by the higher<br />
prices for Canadian oil that the market access provided by the TMEP<br />
would allow.<br />
Table 1<br />
Summary of the Impacts of TMEP<br />
(cumulative effects, 2012–38)<br />
British Columbia<br />
Alberta<br />
Other provinces/<br />
territories<br />
Canada<br />
Original Impacts<br />
Employment effects (person-years) 75,110 27,978 20,133 123,221<br />
Project development 35,864 14,632 7,541 58,037<br />
Project operations 39,246 13,346 12,591 65,184<br />
GDP effects (2012 $ millions) 13,937 74,851 6,818 95,606<br />
Project development 2,789 1,402 660 4,852<br />
Project operations 11,073 5,132 1,069 17,274<br />
Higher netbacks 75 68,316 5,088 73,480<br />
Fiscal impact (2012 $ millions) 2,956 14,461 10,812 28,230<br />
Project development 394 239 581 1,214<br />
Project operations 1,191 568 1,546 3,305<br />
Higher netbacks 1,371 13,655 8,685 23,710<br />
Additional Impacts<br />
Employment effects (person-years) 114,076 413,254 151,065 678,395<br />
Dividend payments 11,408 11,194 40,817 63,419<br />
Oil and gas investment 80,405 400,662 107,107 588,175<br />
Additional tanker traffic 22,263 1,398 3,141 26,802<br />
(continued ...)<br />
Find Conference Board research at www.e-library.ca.<br />
4