Calendario de Indicadores Económicos (11 al 15 de marzo de 2013)
Calendario de Indicadores Económicos (11 al 15 de marzo de 2013)
Calendario de Indicadores Económicos (11 al 15 de marzo de 2013)

You also want an ePaper? Increase the reach of your titles
YUMPU automatically turns print PDFs into web optimized ePapers that Google loves.
46,000<br />
45,500<br />
45,000<br />
44,500<br />
44,000<br />
43,500<br />
43,000<br />
42,500<br />
42,000<br />
41,500<br />
41,000<br />
40,500<br />
40,000<br />
39,500<br />
39,000<br />
38,500<br />
38,000<br />
37,500<br />
Índice<br />
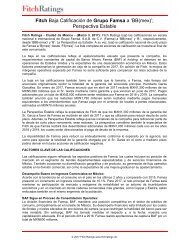
IPyC (Mex) 43,278.<strong>11</strong><br />
Dow Jones (EU) 14,455.28<br />
S&P 500 (EU) 1,554.52<br />
Bovespa (Brasil) 57,385.90<br />
Dax (Alemania) 7,970.91<br />
FTSE 100 (Reino Unido) 6,481.50<br />
CAC40 (Francia) 3,836.04<br />
Nikkei 225 (Japón) 12,239.66<br />
SSE Composite (China) 2,263.97<br />
Acciones con princip<strong>al</strong>es ganancias y pérdidas en el día<br />
1/ Con información <strong>al</strong> cierre <strong>de</strong>l miércoles 13 <strong>de</strong> <strong>marzo</strong> <strong>de</strong> <strong>2013</strong>.<br />
MERCADOS ACCIONARIOS<br />
diaria<br />
Variación %:<br />
Acum en<br />
mensu<strong>al</strong><br />
<strong>2013</strong><br />
Anu<strong>al</strong><br />
RSI <strong>de</strong>l Precio /<br />
Precio* V<strong>al</strong>or en<br />
(9 dias) Libros<br />
Precio /<br />
Utilida<strong>de</strong>s<br />
V<strong>al</strong>or <strong>de</strong> la<br />
Empresa /<br />
EBITDA 12<br />
(1.56) (1.86) (0.98) 13.83 45.19 3.24 18.61<br />
meses<br />
8.80<br />
0.04 3.38 10.31 9.70 77.75 2.86 14.08 8.29<br />
0.13 2.25 9.00 <strong>11</strong>.36 69.45 2.32 <strong>15</strong>.35 9.41<br />
(1.41) (1.75) (5.85) (16.10) 54.55 1.10 22.58 10.82<br />
0.06 3.36 4.71 13.94 66.34 1.52 <strong>15</strong>.63 7.45<br />
(0.45) 1.92 9.90 8.82 71.16 1.82 18.28 8.02<br />
(0.10) 3.72 5.35 8.05 66.70 1.26 14.70 6.83<br />
(0.61) 8.25 17.74 21.78 70.86 1.48 24.56 9.58<br />
(0.99) (6.92) (0.23) (5.32) 35.41 1.65 12.54 9.93<br />
Fuente: Bloomberg. *Indice <strong>de</strong> Fort<strong>al</strong>eza Relativa (Relative Strength In<strong>de</strong>x) que oscila en una esc<strong>al</strong>a entre 0 y 100.<br />
Una lectura entre 70 y 80 <strong>al</strong>erta sobre una condicion <strong>de</strong> sobrecompra que implicaria que se aproxima a una correccion a la baja.<br />
Lecturas entre 30 y 20 se consi<strong>de</strong>ran condiciones <strong>de</strong> sobreventa y <strong>al</strong>ertan <strong>de</strong> una inminente correccion <strong>al</strong> <strong>al</strong>za.<br />
IPyC S&P´s 500<br />
GEOB<br />
ARA<br />
GFNORTEO<br />
GRUMAB<br />
BOLSAA<br />
AXTELCPO<br />
ASURB<br />
AZTECACP<br />
AMXL<br />
URBI<br />
-2.4<br />
-3.7<br />
-7.8<br />
2.0<br />
2.0<br />
1.7<br />
2.1<br />
-8.4<br />
2.6<br />
-8.7<br />
14 <strong>de</strong> <strong>marzo</strong>, <strong>2013</strong><br />
Acciones con princip<strong>al</strong>es ganancias y pérdidas en el año<br />
Dirección <strong>de</strong> Análisis Económico y Administración Integr<strong>al</strong> <strong>de</strong> Riesgos 4<br />
1,550<br />
1,530<br />
1,510<br />
1,490<br />
1,470<br />
1,450<br />
1,430<br />
1,410<br />
1,390<br />
1,370<br />
1,350<br />
1,330<br />
1,310<br />
1,290<br />
Promedio móvil 23 días<br />
KIMBERA<br />
GRUMAB<br />
ICA<br />
ALSEA<br />
AXTELCPO<br />
MEXCHEM<br />
PE&OLES<br />
AMXL<br />
GEOB<br />
URBI<br />
Promedio móvil 100 días<br />
37,000<br />
1,270<br />
36,500<br />
mar-12 abr-12 may-12 jun-12 jul-12 ago-12 sep-12 oct-12 nov-12 dic-12 ene-13 feb-13 mar-13<br />
1,250<br />
mar-12 abr-12 may-12 jun-12 jul-12 ago-12 sep-12 oct-12 nov-12 dic-12 ene-13 feb-13<br />
1000<br />
0<br />
-1000<br />
Promedio móvil 23 días<br />
Promedio móvil 100 días<br />
ene-12 mar-12 may-12 jul-12 sep-12 nov-12 ene-13<br />
MACD (26,12) SEÑAL(9)<br />
50<br />
0<br />
-50<br />
ene-12 mar-12 may-12 jul-12 sep-12 nov-12 ene-13<br />
MACD (26,12) SEÑAL(9)<br />
-10.4<br />
-10.8<br />
-20.6<br />
-41.9<br />
28.1<br />
27.7<br />
26.9<br />
26.8<br />
26.8<br />
-57.2<br />
/1