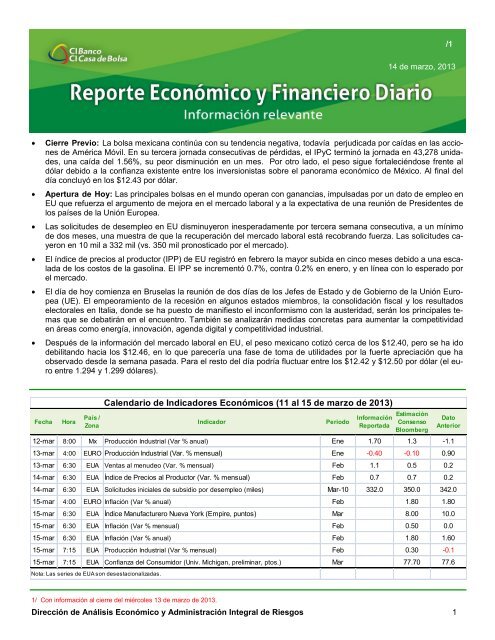
Calendario de Indicadores Económicos (11 al 15 de marzo de 2013)
Calendario de Indicadores Económicos (11 al 15 de marzo de 2013)
Calendario de Indicadores Económicos (11 al 15 de marzo de 2013)

You also want an ePaper? Increase the reach of your titles
YUMPU automatically turns print PDFs into web optimized ePapers that Google loves.
Cierre Previo: La bolsa mexicana continúa con su ten<strong>de</strong>ncia negativa, todavía perjudicada por caídas en las acciones<br />
<strong>de</strong> América Móvil. En su tercera jornada consecutivas <strong>de</strong> pérdidas, el IPyC terminó la jornada en 43,278 unida<strong>de</strong>s,<br />
una caída <strong>de</strong>l 1.56%, su peor disminución en un mes. Por otro lado, el peso sigue fort<strong>al</strong>eciéndose frente <strong>al</strong><br />
dólar <strong>de</strong>bido a la confianza existente entre los inversionistas sobre el panorama económico <strong>de</strong> México. Al fin<strong>al</strong> <strong>de</strong>l<br />
día concluyó en los $12.43 por dólar.<br />
Apertura <strong>de</strong> Hoy: Las princip<strong>al</strong>es bolsas en el mundo operan con ganancias, impulsadas por un dato <strong>de</strong> empleo en<br />
EU que refuerza el argumento <strong>de</strong> mejora en el mercado labor<strong>al</strong> y a la expectativa <strong>de</strong> una reunión <strong>de</strong> Presi<strong>de</strong>ntes <strong>de</strong><br />
los países <strong>de</strong> la Unión Europea.<br />
Las solicitu<strong>de</strong>s <strong>de</strong> <strong>de</strong>sempleo en EU disminuyeron inesperadamente por tercera semana consecutiva, a un mínimo<br />
<strong>de</strong> dos meses, una muestra <strong>de</strong> que la recuperación <strong>de</strong>l mercado labor<strong>al</strong> está recobrando fuerza. Las solicitu<strong>de</strong>s cayeron<br />
en 10 mil a 332 mil (vs. 350 mil pronosticado por el mercado).<br />
El índice <strong>de</strong> precios <strong>al</strong> productor (IPP) <strong>de</strong> EU registró en febrero la mayor subida en cinco meses <strong>de</strong>bido a una esc<strong>al</strong>ada<br />
<strong>de</strong> los costos <strong>de</strong> la gasolina. El IPP se incrementó 0.7%, contra 0.2% en enero, y en línea con lo esperado por<br />
el mercado.<br />
El día <strong>de</strong> hoy comienza en Bruselas la reunión <strong>de</strong> dos días <strong>de</strong> los Jefes <strong>de</strong> Estado y <strong>de</strong> Gobierno <strong>de</strong> la Unión Europea<br />
(UE). El empeoramiento <strong>de</strong> la recesión en <strong>al</strong>gunos estados miembros, la consolidación fisc<strong>al</strong> y los resultados<br />
elector<strong>al</strong>es en It<strong>al</strong>ia, don<strong>de</strong> se ha puesto <strong>de</strong> manifiesto el inconformismo con la austeridad, serán los princip<strong>al</strong>es temas<br />
que se <strong>de</strong>batirán en el encuentro. También se an<strong>al</strong>izarán medidas concretas para aumentar la competitividad<br />
en áreas como energía, innovación, agenda digit<strong>al</strong> y competitividad industri<strong>al</strong>.<br />
Después <strong>de</strong> la información <strong>de</strong>l mercado labor<strong>al</strong> en EU, el peso mexicano cotizó cerca <strong>de</strong> los $12.40, pero se ha ido<br />
<strong>de</strong>bilitando hacia los $12.46, en lo que parecería una fase <strong>de</strong> toma <strong>de</strong> utilida<strong>de</strong>s por la fuerte apreciación que ha<br />
observado <strong>de</strong>s<strong>de</strong> la semana pasada. Para el resto <strong>de</strong>l día podría fluctuar entre los $12.42 y $12.50 por dólar (el euro<br />
entre 1.294 y 1.299 dólares).<br />
Fecha Hora<br />
País /<br />
Zona<br />
1/ Con información <strong>al</strong> cierre <strong>de</strong>l miércoles 13 <strong>de</strong> <strong>marzo</strong> <strong>de</strong> <strong>2013</strong>.<br />
Indicador Periodo<br />
Información<br />
Reportada<br />
14 <strong>de</strong> <strong>marzo</strong>, <strong>2013</strong><br />
Estimación<br />
Consenso<br />
Bloomberg<br />
12-mar 8:00 Mx Producción Industri<strong>al</strong> (Var % anu<strong>al</strong>) Ene 1.70 1.3 -1.1<br />
13-mar 4:00 EURO Producción Industri<strong>al</strong> (Var. % mensu<strong>al</strong>) Ene -0.40 -0.10 0.90<br />
13-mar 6:30 EUA Ventas <strong>al</strong> menu<strong>de</strong>o (Var. % mensu<strong>al</strong>) Feb 1.1 0.5 0.2<br />
14-mar 6:30 EUA Índice <strong>de</strong> Precios <strong>al</strong> Productor (Var. % mensu<strong>al</strong>) Feb 0.7 0.7 0.2<br />
Dirección <strong>de</strong> Análisis Económico y Administración Integr<strong>al</strong> <strong>de</strong> Riesgos 1<br />
/1<br />
Dato<br />
Anterior<br />
14-mar 6:30 EUA Solicitu<strong>de</strong>s inici<strong>al</strong>es <strong>de</strong> subsidio por <strong>de</strong>sempleo (miles) Mar-10 332.0 350.0 342.0<br />
<strong>15</strong>-mar 4:00 EURO Inflación (Var % anu<strong>al</strong>) Feb 1.80 1.80<br />
<strong>15</strong>-mar 6:30 EUA Índice Manufacturero Nueva York (Empire, puntos) Mar 8.00 10.0<br />
<strong>15</strong>-mar 6:30 EUA Inflación (Var % mensu<strong>al</strong>) Feb 0.50 0.0<br />
<strong>15</strong>-mar 6:30 EUA Inflación (Var % anu<strong>al</strong>) Feb 1.80 1.60<br />
<strong>15</strong>-mar 7:<strong>15</strong> EUA Producción Industri<strong>al</strong> (Var % mensu<strong>al</strong>) Feb 0.30 -0.1<br />
<strong>15</strong>-mar 7:<strong>15</strong> EUA Confianza <strong>de</strong>l Consumidor (Univ. Michigan, preliminar, ptos.) Mar 77.70 77.6<br />
Nota: Las series <strong>de</strong> EUA son <strong>de</strong>sestacion<strong>al</strong>izadas.<br />
<strong>C<strong>al</strong>endario</strong> <strong>de</strong> <strong>Indicadores</strong> <strong>Económicos</strong> (<strong>11</strong> <strong>al</strong> <strong>15</strong> <strong>de</strong> <strong>marzo</strong> <strong>de</strong> <strong>2013</strong>)
Pesos por divisa<br />
14.40<br />
14.20<br />
14.00<br />
13.80<br />
13.60<br />
13.40<br />
13.20<br />
13.00<br />
12.80<br />
12.60<br />
12.40<br />
12-mar-12<br />
12.84<br />
12.80<br />
12.76<br />
12.72<br />
12.68<br />
12.64<br />
12.60<br />
12.56<br />
12.52<br />
12.48<br />
12.44<br />
12.40<br />
27-mar-12<br />
<strong>11</strong>-abr-12<br />
Tipo <strong>de</strong> Cambio Spot en un año (pesos por dólar)<br />
26-abr-12<br />
<strong>11</strong>-may-12<br />
26-may-12<br />
10-jun-12<br />
25-jun-12<br />
10-jul-12<br />
25-jul-12<br />
MERCADO DE DIVISAS<br />
Cierre<br />
09-ago-12<br />
Pesos por dólar en un mes<br />
1/ Con información <strong>al</strong> cierre <strong>de</strong>l miércoles 13 <strong>de</strong> <strong>marzo</strong> <strong>de</strong> <strong>2013</strong>.<br />
24-ago-12<br />
08-sep-12<br />
23-sep-12<br />
Diaria Mensu<strong>al</strong> Acum. Anu<strong>al</strong><br />
Dólar Fix 12.40 -0.5 -2.5 -4.4 -2.5 12.97<br />
Dólar Spot EE.UU. 12.43 -0.1 -2.0 -3.3 -1.8 12.85<br />
Euro Spot 16.<strong>11</strong> -0.7 -5.6 -5.0 -3.3 16.96<br />
Libra Spot 18.55 0.0 -5.9 -<strong>11</strong>.2 -6.3 20.88<br />
Dólar Canadiense Spot 12.09 -0.3 -4.5 -6.6 -5.2 12.96<br />
Yen Spot 0.13 -0.8 -5.1 -12.8 -16.2 0.<strong>15</strong><br />
Franco Suizo Spot 13.05 -0.7 -5.7 -7.0 -5.5 14.04<br />
Dólar por Euro 1.2959 -0.6 -3.7 -1.8 -1.5 1.32<br />
Yen por dólar 96.<strong>11</strong> 0.0 2.9 10.8 16.9 86.75<br />
Forwards tipo <strong>de</strong> cambio 1 m. 3 m. 6 m. 12 m.<br />
pesos/usd 12.47<br />
12.54<br />
Promedio móvil 23 días<br />
08-oct-12<br />
23-oct-12<br />
07-nov-12<br />
Promedio móvil 100 días<br />
12-feb<br />
13-feb<br />
14-feb<br />
<strong>15</strong>-feb<br />
16-feb<br />
17-feb<br />
18-feb<br />
19-feb<br />
20-feb<br />
21-feb<br />
22-feb<br />
23-feb<br />
24-feb<br />
25-feb<br />
26-feb<br />
27-feb<br />
28-feb<br />
1-mar<br />
2-mar<br />
3-mar<br />
4-mar<br />
5-mar<br />
6-mar<br />
7-mar<br />
8-mar<br />
9-mar<br />
10-mar<br />
<strong>11</strong>-mar<br />
12-mar<br />
13-mar<br />
22-nov-12<br />
12.64<br />
07-dic-12<br />
22-dic-12<br />
06-ene-13<br />
21-ene-13<br />
12.85<br />
Nota: Signo ( +) = <strong>de</strong>preciación <strong>de</strong> la moneda. Signo( - )= apreciación <strong>de</strong> la moneda.<br />
Spot: operaciones <strong>al</strong> mayoreo a la venta. Fuente: Bloomberg.<br />
Variación %<br />
05-feb-13<br />
20-feb-13<br />
07-mar-13<br />
12.43<br />
14 <strong>de</strong> <strong>marzo</strong>, <strong>2013</strong><br />
Dirección <strong>de</strong> Análisis Económico y Administración Integr<strong>al</strong> <strong>de</strong> Riesgos 2<br />
Cierre<br />
2012<br />
1.36<br />
1.34<br />
1.32<br />
1.30<br />
1.28<br />
1.26<br />
1.24<br />
1.22<br />
1.20<br />
Tipo <strong>de</strong> Cambio Spot en un año (dólares por euro)<br />
Promedio móvil 23 días<br />
Promedio móvil 100 días<br />
12-mar-12<br />
26-mar-12<br />
09-abr-12<br />
23-abr-12<br />
07-may-12<br />
21-may-12<br />
04-jun-12<br />
18-jun-12<br />
02-jul-12<br />
16-jul-12<br />
30-jul-12<br />
13-ago-12<br />
27-ago-12<br />
10-sep-12<br />
24-sep-12<br />
08-oct-12<br />
22-oct-12<br />
05-nov-12<br />
19-nov-12<br />
03-dic-12<br />
17-dic-12<br />
31-dic-12<br />
14-ene-13<br />
28-ene-13<br />
<strong>11</strong>-feb-13<br />
25-feb-13<br />
<strong>11</strong>-mar-13<br />
17.80<br />
17.60<br />
17.40<br />
17.20<br />
17.00<br />
16.80<br />
16.60<br />
16.40<br />
16.20<br />
16.00<br />
Evolución <strong>de</strong> monedas vs. dólar estadouni<strong>de</strong>nse<br />
Pesos por euro en un año<br />
Var % diaria Var % en el año<br />
Re<strong>al</strong> brasileño 0.4 (4.2)<br />
Peso mexicano (0.8) (3.2)<br />
Peso chileno (0.2) (1.7)<br />
Rupia hindú (0.4) (1.5)<br />
Rupia indonesa (0.1) (1.0)<br />
Yuan chino (0.0) (0.2)<br />
Rublo ruso (0.1) 0.6<br />
Dólar austr<strong>al</strong>iano (0.4) 0.7<br />
Euro 0.1 1.2<br />
Peso colombiano (0.1) 1.9<br />
Nuevo dólar taiwanés (0.0) 2.2<br />
Zloty polaco 0.0 2.7<br />
Won coreano 0.0 2.9<br />
Peso argentino 0.1 3.3<br />
Rand sudafricano 0.9 8.2<br />
Libra esterlina 0.1 8.3<br />
Yen japonés (0.2) 10.8<br />
Monedas or<strong>de</strong>nadas por rendimiento acumulado en el año.<br />
12-mar-12<br />
26-mar-12<br />
09-abr-12<br />
23-abr-12<br />
07-may-12<br />
21-may-12<br />
04-jun-12<br />
18-jun-12<br />
02-jul-12<br />
16-jul-12<br />
30-jul-12<br />
13-ago-12<br />
27-ago-12<br />
10-sep-12<br />
24-sep-12<br />
08-oct-12<br />
22-oct-12<br />
05-nov-12<br />
19-nov-12<br />
03-dic-12<br />
17-dic-12<br />
31-dic-12<br />
14-ene-13<br />
28-ene-13<br />
<strong>11</strong>-feb-13<br />
25-feb-13<br />
<strong>11</strong>-mar-13<br />
/1
TASAS DE INTERÉS NACIONALES ( %)<br />
Tasa<br />
actu<strong>al</strong><br />
Variación %<br />
Diaria<br />
Acum en<br />
<strong>2013</strong><br />
Precio<br />
actu<strong>al</strong><br />
Prom.<br />
<strong>2013</strong><br />
1/ Con información <strong>al</strong> cierre <strong>de</strong>l miércoles 13 <strong>de</strong> <strong>marzo</strong> <strong>de</strong> <strong>2013</strong>.<br />
prom. cierre<br />
Tasas Nacion<strong>al</strong>es<br />
Tasa Objetivo Banxico 4.00 4.00 4.46 4.50 4.50<br />
Fon<strong>de</strong>o Bancario* 4.01 4.01 4.47 4.49 4.51<br />
Cetes 28 días 3.96 4.07 4.<strong>15</strong> 4.23 4.04<br />
Cetes 91 días 4.00 4.09 4.21 4.37 4.23<br />
Cetes 182 días 4.05 4.21 4.30 4.51 4.49<br />
Cetes 364 días 4.22 4.31 4.37 4.62 4.61<br />
TIIE 28 4.32 4.34 4.79 4.79 4.85<br />
TIIE 91 4.33 4.35 4.79 4.81 4.87<br />
Bonos <strong>de</strong> tasa fija (subasta primaria)<br />
3 años 4.85 4.72 4.87 4.87 4.85<br />
5 años 4.79 5.07 5.13 5.13 4.79<br />
10 años 5.44 5.12 5.84 5.84 5.44<br />
20 años 6.57 6.22 6.98 6.98 6.57<br />
30 años 6.49 6.22 7.12 7.12 6.49<br />
UDIS 4.93 4.93 4.90 4.78 4.87<br />
Udibonos 30 años 2.81 2.38 2.47 2.91 2.81<br />
UMS 2017 (dólares) 1.46 1.41 1.85 3.09 2.44<br />
Instrumentos IPAB (sobretasa)<br />
Tasa<br />
anterior<br />
Prom.<br />
<strong>2013</strong><br />
BPA´s 1 año 1\ 0.25 0.25 0.25 0.25 0.25<br />
BPAT´s 5 años 2\ 0.37 0.38 0.36 0.36 0.37<br />
BPA 182 7 años 3\ 0.37 0.36 0.35 0.27 0.30<br />
1\ Cupón aplicable <strong>al</strong> rendimiento en el mercado primario <strong>de</strong> Cetes a 28 días.<br />
2\ Cupón aplicable <strong>al</strong> rendimiento en el mercado primario <strong>de</strong> Cetes a 91 días.<br />
3\ Cupón aplicable <strong>al</strong> rendimiento en el mercado primario <strong>de</strong> Cetes a 182 días.<br />
2012<br />
BONOS GUBERNAMENTALES, mercado secundario (%)<br />
Tasa Tasa Prom. 2012<br />
actu<strong>al</strong> anterior <strong>2013</strong> prom. cierre<br />
MBONO Jun-2014 4.09 4.10 4.40 5.43 5.02<br />
MBONO Dic-2014 4.10 4.12 4.42 5.59 5.12<br />
MBONO Dic-20<strong>15</strong> 4.35 4.36 4.58 5.87 5.38<br />
MBONO Dic-2024 4.87 4.91 5.18 7.06 6.64<br />
MBONO Jun-2027 5.20 5.25 5.56 7.41 7.09<br />
Índice Gener<strong>al</strong> <strong>de</strong> Commodities* (0.4) (2.0) 1,545.2 1,581 1,577<br />
WTI (usd/barril) (0.0) 0.8 92.52 94.3 91.8<br />
Mezcla Mexicana (usd/barril) 0.3 7.6 104.03 104.1 96.7<br />
Oro (usd/onza troy) (0.3) (5.2) 1,588.2 1,653.6 1,675.4<br />
Plata (usd/onza troy) (0.1) (4.7) 28.9 30.6 30.3<br />
Cobre (usd/kg) 1.8 (1.4) 360.2 368.9 365.5<br />
Indice Agricola (0.4) (3.2) 1,722 1,749 1,779<br />
Maiz (usd/bushel) 0.6 5.8 7.3 7.1 6.9<br />
Cierre<br />
2012<br />
*Indice compuesto por precios <strong>de</strong> 26 commodities <strong>de</strong> energeticos, met<strong>al</strong>es y agropecuarios. Fuente: Bloomberg,<br />
USDA, UBS Investment Bank.<br />
MERCADO DE BONOS A 10 AÑOS (%)<br />
Actu<strong>al</strong> Previo<br />
14 <strong>de</strong> <strong>marzo</strong>, <strong>2013</strong><br />
RIESGO PAÍS (medido por spread <strong>de</strong> CDS* soberano, puntos base)<br />
EU 2.02 2.02 1.76 México 4.85 4.87 5.38<br />
Zona Euro 1.48 1.48 1.32 Chile 5.49 5.49 5.45<br />
Japon 0.63 0.64 0.79 Brasil 9.59 9.48 9.17<br />
Reino Unido 1.97 1.96 1.83 Portug<strong>al</strong> 5.93 5.93 7.01<br />
It<strong>al</strong>ia 4.67 4.61 4.50 Grecia 10.70 10.63 <strong>11</strong>.90<br />
Espania 4.77 4.73 5.27 China 3.60 3.60 3.59<br />
Fuente: Bloomberg y ABM. Mercado Secundario<br />
Dirección <strong>de</strong> Análisis Económico y Administración Integr<strong>al</strong> <strong>de</strong> Riesgos 3<br />
120<br />
<strong>11</strong>0<br />
100<br />
90<br />
80<br />
70<br />
60<br />
50<br />
40<br />
30<br />
V<strong>al</strong>or<br />
actu<strong>al</strong><br />
V<strong>al</strong>or<br />
Previo<br />
Cierre<br />
2012<br />
Minimo<br />
en 12<br />
meses<br />
Maximo<br />
en 12<br />
meses<br />
Actu<strong>al</strong> Previo<br />
/1<br />
Cierre Prom.<br />
Colombia 95 95 87 169 96 <strong>11</strong>9<br />
México 95 95 84 172 98 120<br />
Brasil 125 125 96 178 108 130<br />
Francia 78 78 61 225 91 <strong>15</strong>3<br />
It<strong>al</strong>ia 265 265 218 576 278 404<br />
Espania 258 258 239 647 295 431<br />
Irlanda 163 163 <strong>15</strong>7 743 220 475<br />
Portug<strong>al</strong> 376 376 350 1,354 449 855<br />
*Credit Default Sw ap <strong>de</strong> <strong>de</strong>uda soberana a 5 años. Fuente: Bloomberg<br />
TASAS DE INTERÉS EN EU ( %)<br />
Tasa<br />
actu<strong>al</strong><br />
Tasa<br />
anterior<br />
Prom.<br />
<strong>2013</strong><br />
2012<br />
2012<br />
prom. cierre<br />
Fondos Fe<strong>de</strong>r<strong>al</strong>es E.U. 0.25 0.25 0.25 0.25 0.25<br />
T-Bill 3 meses 0.10 0.<strong>11</strong> 0.09 0.09 0.09<br />
5 años 0.88 0.87 0.82 0.75 0.72<br />
10 años 2.02 2.02 1.93 1.78 1.75<br />
30 años 3.22 3.21 3.12 2.92 2.95<br />
Libor 3 meses 0.28 0.28 0.29 0.43 0.31<br />
Libor 12 meses 0.73 0.73 0.78 1.01 0.84<br />
Tasa PRIME 3.25 3.25 3.25 3.25 3.25<br />
ene-09<br />
mar-09<br />
may-09<br />
jul-09<br />
WTI (usd/barril) EJE IZQ. Oro (usd/onza troy) EJE DER.<br />
sep-09<br />
nov-09<br />
ene-10<br />
mar-10<br />
may-10<br />
jul-10<br />
sep-10<br />
nov-10<br />
ene-<strong>11</strong><br />
mar-<strong>11</strong><br />
may-<strong>11</strong><br />
jul-<strong>11</strong><br />
sep-<strong>11</strong><br />
nov-<strong>11</strong><br />
ene-12<br />
mar-12<br />
may-12<br />
jul-12<br />
Cierre 2012<br />
2,000<br />
1,800<br />
1,600<br />
1,400<br />
1,200<br />
1,000<br />
800
46,000<br />
45,500<br />
45,000<br />
44,500<br />
44,000<br />
43,500<br />
43,000<br />
42,500<br />
42,000<br />
41,500<br />
41,000<br />
40,500<br />
40,000<br />
39,500<br />
39,000<br />
38,500<br />
38,000<br />
37,500<br />
Índice<br />
IPyC (Mex) 43,278.<strong>11</strong><br />
Dow Jones (EU) 14,455.28<br />
S&P 500 (EU) 1,554.52<br />
Bovespa (Brasil) 57,385.90<br />
Dax (Alemania) 7,970.91<br />
FTSE 100 (Reino Unido) 6,481.50<br />
CAC40 (Francia) 3,836.04<br />
Nikkei 225 (Japón) 12,239.66<br />
SSE Composite (China) 2,263.97<br />
Acciones con princip<strong>al</strong>es ganancias y pérdidas en el día<br />
1/ Con información <strong>al</strong> cierre <strong>de</strong>l miércoles 13 <strong>de</strong> <strong>marzo</strong> <strong>de</strong> <strong>2013</strong>.<br />
MERCADOS ACCIONARIOS<br />
diaria<br />
Variación %:<br />
Acum en<br />
mensu<strong>al</strong><br />
<strong>2013</strong><br />
Anu<strong>al</strong><br />
RSI <strong>de</strong>l Precio /<br />
Precio* V<strong>al</strong>or en<br />
(9 dias) Libros<br />
Precio /<br />
Utilida<strong>de</strong>s<br />
V<strong>al</strong>or <strong>de</strong> la<br />
Empresa /<br />
EBITDA 12<br />
(1.56) (1.86) (0.98) 13.83 45.19 3.24 18.61<br />
meses<br />
8.80<br />
0.04 3.38 10.31 9.70 77.75 2.86 14.08 8.29<br />
0.13 2.25 9.00 <strong>11</strong>.36 69.45 2.32 <strong>15</strong>.35 9.41<br />
(1.41) (1.75) (5.85) (16.10) 54.55 1.10 22.58 10.82<br />
0.06 3.36 4.71 13.94 66.34 1.52 <strong>15</strong>.63 7.45<br />
(0.45) 1.92 9.90 8.82 71.16 1.82 18.28 8.02<br />
(0.10) 3.72 5.35 8.05 66.70 1.26 14.70 6.83<br />
(0.61) 8.25 17.74 21.78 70.86 1.48 24.56 9.58<br />
(0.99) (6.92) (0.23) (5.32) 35.41 1.65 12.54 9.93<br />
Fuente: Bloomberg. *Indice <strong>de</strong> Fort<strong>al</strong>eza Relativa (Relative Strength In<strong>de</strong>x) que oscila en una esc<strong>al</strong>a entre 0 y 100.<br />
Una lectura entre 70 y 80 <strong>al</strong>erta sobre una condicion <strong>de</strong> sobrecompra que implicaria que se aproxima a una correccion a la baja.<br />
Lecturas entre 30 y 20 se consi<strong>de</strong>ran condiciones <strong>de</strong> sobreventa y <strong>al</strong>ertan <strong>de</strong> una inminente correccion <strong>al</strong> <strong>al</strong>za.<br />
IPyC S&P´s 500<br />
GEOB<br />
ARA<br />
GFNORTEO<br />
GRUMAB<br />
BOLSAA<br />
AXTELCPO<br />
ASURB<br />
AZTECACP<br />
AMXL<br />
URBI<br />
-2.4<br />
-3.7<br />
-7.8<br />
2.0<br />
2.0<br />
1.7<br />
2.1<br />
-8.4<br />
2.6<br />
-8.7<br />
14 <strong>de</strong> <strong>marzo</strong>, <strong>2013</strong><br />
Acciones con princip<strong>al</strong>es ganancias y pérdidas en el año<br />
Dirección <strong>de</strong> Análisis Económico y Administración Integr<strong>al</strong> <strong>de</strong> Riesgos 4<br />
1,550<br />
1,530<br />
1,510<br />
1,490<br />
1,470<br />
1,450<br />
1,430<br />
1,410<br />
1,390<br />
1,370<br />
1,350<br />
1,330<br />
1,310<br />
1,290<br />
Promedio móvil 23 días<br />
KIMBERA<br />
GRUMAB<br />
ICA<br />
ALSEA<br />
AXTELCPO<br />
MEXCHEM<br />
PE&OLES<br />
AMXL<br />
GEOB<br />
URBI<br />
Promedio móvil 100 días<br />
37,000<br />
1,270<br />
36,500<br />
mar-12 abr-12 may-12 jun-12 jul-12 ago-12 sep-12 oct-12 nov-12 dic-12 ene-13 feb-13 mar-13<br />
1,250<br />
mar-12 abr-12 may-12 jun-12 jul-12 ago-12 sep-12 oct-12 nov-12 dic-12 ene-13 feb-13<br />
1000<br />
0<br />
-1000<br />
Promedio móvil 23 días<br />
Promedio móvil 100 días<br />
ene-12 mar-12 may-12 jul-12 sep-12 nov-12 ene-13<br />
MACD (26,12) SEÑAL(9)<br />
50<br />
0<br />
-50<br />
ene-12 mar-12 may-12 jul-12 sep-12 nov-12 ene-13<br />
MACD (26,12) SEÑAL(9)<br />
-10.4<br />
-10.8<br />
-20.6<br />
-41.9<br />
28.1<br />
27.7<br />
26.9<br />
26.8<br />
26.8<br />
-57.2<br />
/1
Tasas Brutas<br />
Tasas <strong>de</strong> interés vigentes <strong>de</strong>l 12 <strong>al</strong> 18 <strong>de</strong> <strong>marzo</strong> <strong>de</strong> <strong>2013</strong> (% anu<strong>al</strong>)<br />
Pagaré con rendimiento liquidable <strong>al</strong> vencimiento (PRLV) en moneda nacion<strong>al</strong><br />
Rangos (pesos)<br />
1/ Con información <strong>al</strong> cierre <strong>de</strong>l miércoles 13 <strong>de</strong> <strong>marzo</strong> <strong>de</strong> <strong>2013</strong>.<br />
Certificados <strong>de</strong> Depósito (CEDES)<br />
Rangos (pesos)<br />
De 10,000 a 49,999<br />
De 50,000 a 99,999<br />
De 100,000 a 499,999<br />
De 500,000 a 999,999<br />
De 1,000,000 a 4,999,999<br />
Más <strong>de</strong> 5,000,000<br />
Plazos (días)<br />
1 7 14 21 28 91 180 360<br />
10,000-99,999 2.73 2.83 3.00 3.01 3.17 3.39 3.43 3.53<br />
100,000-999,999 3.16 3.27 3.46 3.50 3.61 3.86 3.89 4.07<br />
1,000,000-4,999,999 3.52 3.63 3.73 3.83 3.97 4.08 4.12 4.18<br />
5,000,000-9,999,999 3.71 3.78 3.86 3.95 4.07 4.10 4.14 4.20<br />
Mas <strong>de</strong> 10,000,000 3.76 3.83 3.91 4.00 4.12 4.<strong>15</strong> 4.19 4.25<br />
Bruta (plazos días)<br />
84 168 364<br />
3.09 3.13 3.20<br />
3.34 3.37 3.45<br />
3.57 3.61 3.70<br />
3.81 3.85 3.95<br />
3.90 3.95 4.05<br />
4.09 4.14 4.25<br />
Inversión a plazo en dólares: Tasa <strong>de</strong> interés (% anu<strong>al</strong>)<br />
Rangos (dólares)<br />
Tasas Brutas (plazos días)<br />
1 7 28 91 182 360<br />
De 10,000 a 24,999 0.00 0.00 0.28 0.33 0.41 0.44<br />
De 25,000 a 49,999 0.18 0.19 0.50 0.54 0.60 0.64<br />
De 50,000 a 99,999 0.42 0.43 0.66 0.70 0.78 0.82<br />
De 100,000 a 999,999 0.55 0.56 0.74 0.79 0.85 0.89<br />
Más <strong>de</strong> 1,000,000 0.59 0.60 0.90 1.00 1.<strong>15</strong> 1.30<br />
Rendimiento a 90 días<br />
+CIBOLS 2.74%<br />
+CIVRDE 2.25%<br />
Rendimientos pasados no garantizan<br />
rendimientos futuros.<br />
Familia <strong>de</strong> fondos CI<br />
Características Rendimientos 1<br />
Inversionista Clasificación Fondo Precios <strong>marzo</strong> 90 días<br />
PERSONAS<br />
FISICAS<br />
PERSONAS<br />
MORALES<br />
PERSONAS<br />
EXENTAS<br />
DEUDA MEDIANO<br />
PLAZO<br />
14 <strong>de</strong> <strong>marzo</strong>, <strong>2013</strong><br />
Dirección <strong>de</strong> Análisis Económico y Administración Integr<strong>al</strong> <strong>de</strong> Riesgos 5<br />
Acumulado<br />
<strong>2013</strong><br />
+CIGUB BF-5 1.404344 2.47% 2.65% 2.64%<br />
+CIGUB BF-7 1.3708<strong>11</strong> 1.88% 2.06% 2.05%<br />
+CIPLUS BF 1.629105 2.99% 3.05% 3.09%<br />
+CIUSD BF 1.064134 -69.93% -14.19% -24.01%<br />
+CIUSD BF-D 0.085672 -0.45% -1.61% -1.52%<br />
TC SPOT<br />
(anulaizada)<br />
12.4210<br />
-69.49% -12.63% -22.56%<br />
+CIBOLS BF 2.01439 -0.56% 2.74% 1.03%<br />
IPC 43,278.<strong>11</strong><br />
+CIVRDE BF-7<br />
RENTA VARIABLE<br />
1.475513<br />
+CIVRDE BF-5 1.426136<br />
2<br />
+CIVRDE BF-3 1.4825<strong>15</strong><br />
IPC Sustentable 282.18<br />
-1.13% 0.63% -1.02%<br />
-0.74% 2.25% 0.48%<br />
-0.72% 2.40% 0.59%<br />
-0.70% 2.54% 0.71%<br />
-0.65% 2.92% 0.99%<br />
+CIGUB BM-3 1.451073 3.06% 3.25% 3.24%<br />
+CIGUB BM-5 1.416426 2.47% 2.66% 2.65%<br />
DEUDA M.P. +CIPLUS BM 1.629104 2.99% 3.05% 3.09%<br />
RENTA VARIABLE 2 +CIVRDE BM-1* 1.482516 -0.70% 2.54% 0.71%<br />
+CIGUB BE-1 1.529297 3.98% 4.18% 4.17%<br />
+CIGUB BE-3* 1.434620 2.54% 2.73% 2.72%<br />
+CIGUB BE-5 1.472471 3.07% 3.26% 3.25%<br />
DEUDA M.P. +CIPLUS BE* 1.653516 3.58% 3.65% 3.69%<br />
+CIVRDE BE-1* 1.379028 -0.67% N/A 0.83%<br />
RENTA VARIABLE +CIVRDE BE-3* 1.387500 -0.70% N/A 0.71%<br />
2<br />
+CIBOLS BE 2.081419 -0.54% 2.90% 1.17%<br />
D 1<br />
Rendimiento en dólares<br />
Rendimientos Netos. Incluyen el <strong>de</strong>scuento por concepto <strong>de</strong> ISR<br />
2<br />
Tasas Efectivas<br />
*Rendimientos Estimados: +CIPLUS BM (<strong>de</strong> Nov-<strong>11</strong> a 23-Mar-12),+CIPLUS BE (<strong>de</strong> Nov-<strong>11</strong> a 29-Mar-12), (31/12/12)<br />
+CIBOLS BE (Reinicia 31-Oct-12)<br />
DEUDA CORTO<br />
PLAZO<br />
DEUDA DÓLARES<br />
CORTO-LARGO<br />
PLAZO<br />
DEUDA CORTO<br />
PLAZO<br />
DEUDA CORTO<br />
PLAZO<br />
Inicia Operaciones: +CIGUB BE-3 (el 29-Mar-12), +CIVRDE Series BF(el 1-Oct-12), BM-1 (30-Nov-12), Series BE<br />
Tipo <strong>de</strong> Cambio<br />
Hoy Ayer Variación<br />
SPOT V<strong>al</strong>mer 12.4210 12.4430 -0.18%<br />
/1
INFLACIÓN EN FEBRERO DE <strong>2013</strong> (var. %)<br />
Mensu<strong>al</strong> Acum. Anu<strong>al</strong> Anu<strong>al</strong><br />
(enero '13)<br />
INPC 0.49 0.90 3.55 3.25 Servicios<br />
14 <strong>de</strong> <strong>marzo</strong>, <strong>2013</strong><br />
Mensu<strong>al</strong> Acum. Anu<strong>al</strong> Anu<strong>al</strong><br />
(enero '13)<br />
Subyacente 0.51 0.94 2.96 2.88 No Subyacente 0.44 0.78 5.47 4.47<br />
Mercancías 0.<strong>15</strong> 0.39 3.86 4.37 Agropecuarios 0.02 -0.22 7.48 5.51<br />
Servicios 0.82 1.41 2.21 1.62 Energét. y Tarif. Gob. 0.68 1.36 4.36 3.89<br />
Fuente: INEGI.<br />
Por activida<strong>de</strong>s<br />
IV-12 III-12 II-12 I-12 2012 20<strong>11</strong> III-12 II-12 I-12 IV-<strong>11</strong><br />
PIB 3.2 3.2 4.5 4.9 3.9 3.9 Consumo Privado 2.2 3.4 4.2 4.2<br />
Gasto Gubernament<strong>al</strong> 0.6 2.2 3.2 3.1<br />
Primarias 7.2 1.6 <strong>11</strong> 6.4 6.7 -2.6 Inversión Privada 4.8 6.2 8.6 6.7<br />
Secundarias 4.9 3.6 4.1 4.8 3.6 4.0 Exportaciones 2.4 6.4 5.1 4.4<br />
Terciarias 3.4 3.3 4.7 5.3 4.1 4.8 Importaciones 0.5 4.8 6.7 4.8<br />
Fuente: INEGI. Base 2003.<br />
PRODUCTO INTERNO BRUTO (var. % re<strong>al</strong> anu<strong>al</strong>)<br />
Por componentes<br />
ACTIVIDAD ECONÓMICA y EMPLEO (mensu<strong>al</strong>)<br />
Variación % re<strong>al</strong> anu<strong>al</strong> Tot<strong>al</strong> Creación/pérdida neta <strong>de</strong> empleos<br />
dic-12 ene-dic 12 20<strong>11</strong> 2010 dic-12 dic-12 ene-dic '12 20<strong>11</strong><br />
IGAE 1.4 4.0 4.0 5.6 Tot<strong>al</strong> <strong>de</strong> Trabajadores (miles)** 16,062 -233.0 7<strong>11</strong>.7 590.8<br />
Activida<strong>de</strong>s Primarias <strong>11</strong>.5 7.4 -0.7 6.1 Permanentes (miles) 13,848 -<strong>11</strong>7.0 580.9 440.9<br />
Activida<strong>de</strong>s Secundarias -1.1 3.6 3.8 6.1 Eventu<strong>al</strong>es Urbanos (miles) 2,054 -131.0 <strong>11</strong>8.5 149.9<br />
Ind. Manufactureras -0.9 4.3 5.1 9.9 ene-12 dic-12 nov-12 oct-12<br />
Activida<strong>de</strong>s Terciarias 1.9 4.2 4.3 5.1 Tasa <strong>de</strong> <strong>de</strong>sempleo 5.42% 4.47% 5.12% 5.04%<br />
Ventas <strong>al</strong> menu<strong>de</strong>o -1.8 3.7 3.5 2.4 ** Trabajadores Permanentes y Eventu<strong>al</strong>es Urbanos afiliados en el IMSS.<br />
Fuente: INEGI. Fuente: IMSS.<br />
SECTOR EXTERNO<br />
ene-13 dic-12 2012 20<strong>11</strong> ene-13 dic-12 2012 20<strong>11</strong><br />
Exportaciones -0.2 3.6 6.2 17.2 Importaciones 9.3 4.7 5.7 28.6<br />
Petroleras -1.5 -19.3 -5.9 35.3 Consumo <strong>15</strong>.8 21.8 4.8 26.2<br />
No Petroleras 0.1 8.1 8.5 14.2 Bienes Intermedios 8.0 0.1 5.3 34.5<br />
Manufactureras 1.0 8.9 8.4 13.4 Bienes <strong>de</strong> Capit<strong>al</strong> 9.5 <strong>15</strong>.2 10.1 -1.3<br />
Automotriz 8.3 6.0 <strong>11</strong>.6 21.9 B<strong>al</strong>anza Comerci<strong>al</strong> (md) -2,879.0 -1,272.7 163.0 -3,009.0<br />
dic-12 nov-12<br />
ene-dic<br />
'12<br />
20<strong>11</strong> ene-13 dic-12 2012 20<strong>11</strong><br />
Ingresos por Remesas -4.4 -5.1 1.2 6.8 Reservas Internacion<strong>al</strong>es 163.4 163.6 163.6 142.5<br />
Ingresos por Turismo Internacion<strong>al</strong> 7.2 9.2 7.2 -1.0<br />
Inversión Extranj. Directa (mmd) 12.66 21.50<br />
Fuente: INEGI y Banco <strong>de</strong> México.<br />
Variación % anu<strong>al</strong><br />
Variación % anu<strong>al</strong><br />
Variación % anu<strong>al</strong><br />
S<strong>al</strong>do a fin <strong>de</strong> periodo (mmd)<br />
EXPECTATIVAS ECONÓMICAS CIBanco INDICADORES ECONÓMICOS DE ESTADOS UNIDOS<br />
2012 <strong>2013</strong> 4 T. '12 3 T. '12 2012 20<strong>11</strong><br />
PIB 1/<br />
0.1 3.1 2.2 1.8<br />
PIB México (var. % re<strong>al</strong> anu<strong>al</strong>) 3.90 4.10 ene '13 dic '12 nov '12 2012<br />
Inflación (var. % anu<strong>al</strong>) 3.57 3.70 Precios <strong>al</strong> consumidor 2/<br />
Cetes 28 (cierre) 4.04 4.50 Precios <strong>al</strong> consumidor 3/<br />
Tipo <strong>de</strong> Cambio (pesos por dólar, cierre) 12.85 12.30 Producción industri<strong>al</strong> 2/<br />
PIB Estados Unidos (var. % re<strong>al</strong> anu<strong>al</strong>) 2.20 2.60 Producción industri<strong>al</strong> 3/<br />
0.0 0.0 -0.3<br />
1.6 1.7 1.8 1.7<br />
-0.1 0.4 1.4<br />
2.1 2.2 2.5 3.7<br />
Nota: Series <strong>de</strong>sestacion<strong>al</strong>izadas. Tasa <strong>de</strong> <strong>de</strong>sempleo (%) 7.9 7.8 7.8 8.1<br />
1/ Variación % trimestr<strong>al</strong>, anu<strong>al</strong>izada. 2/ Variación % mensu<strong>al</strong>. 3/ Variación % anu<strong>al</strong>. Empleo generado (miles) <strong>15</strong>7 196 247 2,170<br />
4/ M ichigan Consumer Confi<strong>de</strong>nce Sentiment. ene '12 dic '12 nov '12 2012<br />
Fuente: Bureau of Economic An<strong>al</strong>ysis, Bloomberg Confianza <strong>de</strong>l consumidor 4/<br />
73.8 71.3 82.7 76.5<br />
1/ Con información <strong>al</strong> cierre <strong>de</strong>l miércoles 13 <strong>de</strong> <strong>marzo</strong> <strong>de</strong> <strong>2013</strong>.<br />
Actu<strong>al</strong>ización reciente<br />
Dirección <strong>de</strong> Análisis Económico y Administración Integr<strong>al</strong> <strong>de</strong> Riesgos 6<br />
/1