INTRODUCCIÓN AL SCADA WinCC Un
INTRODUCCIÓN AL SCADA WinCC Un
INTRODUCCIÓN AL SCADA WinCC Un

Create successful ePaper yourself
Turn your PDF publications into a flip-book with our unique Google optimized e-Paper software.
Manual de referencia rápida: <strong>SCADA</strong> WINCC 18<br />
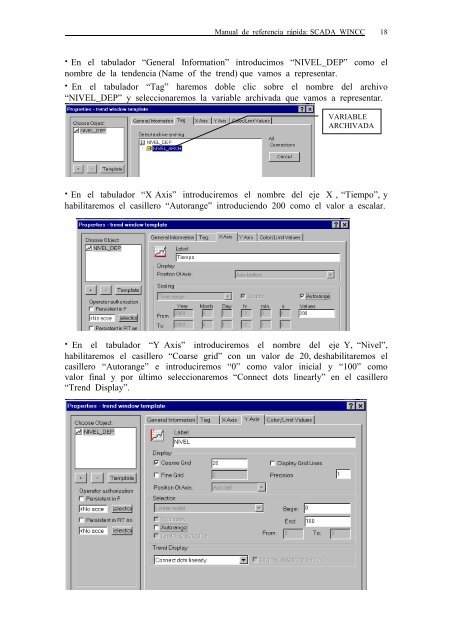
· En el tabulador “General Information” introducimos “NIVEL_DEP” como el<br />
nombre de la tendencia (Name of the trend) que vamos a representar.<br />
· En el tabulador “Tag” haremos doble clic sobre el nombre del archivo<br />
“NIVEL_DEP” y seleccionaremos la variable archivada que vamos a representar.<br />
VARIABLE<br />
ARCHIVADA<br />
· En el tabulador “X Axis” introduciremos el nombre del eje X , “Tiempo”, y<br />
habilitaremos el casillero “Autorange” introduciendo 200 como el valor a escalar.<br />
· En el tabulador “Y Axis” introduciremos el nombre del eje Y, “Nivel”,<br />
habilitaremos el casillero “Coarse grid” con un valor de 20, deshabilitaremos el<br />
casillero “Autorange” e introduciremos “0” como valor inicial y “100” como<br />
valor final y por último seleccionaremos “Connect dots linearly” en el casillero<br />
“Trend Display”.