Enero de 2013 - Fundempresa
Enero de 2013 - Fundempresa
Enero de 2013 - Fundempresa

You also want an ePaper? Increase the reach of your titles
YUMPU automatically turns print PDFs into web optimized ePapers that Google loves.
Estadísticas <strong>de</strong>l Registro <strong>de</strong> Comercio <strong>de</strong> Bolivia<br />
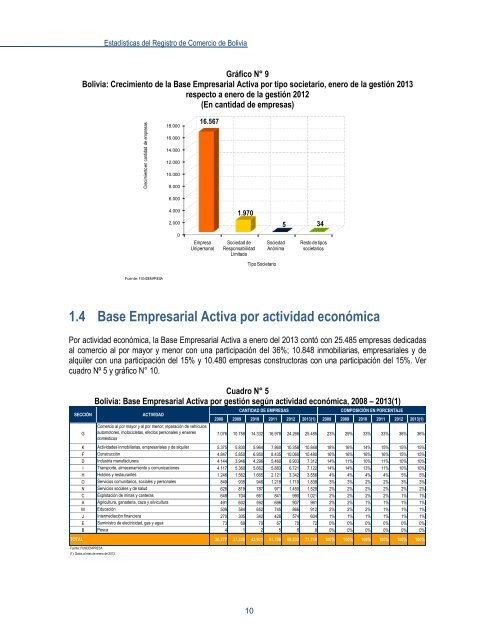
Gráfico N° 9<br />
Bolivia: Crecimiento <strong>de</strong> la Base Empresarial Activa por tipo societario, enero <strong>de</strong> la gestión <strong>2013</strong><br />
respecto a enero <strong>de</strong> la gestión 2012<br />
(En cantidad <strong>de</strong> empresas)<br />
Crecimiento en cantidad <strong>de</strong> empresas<br />
Fuente: FUNDEMPRESA<br />
18.000<br />
16.000<br />
14.000<br />
12.000<br />
10.000<br />
8.000<br />
6.000<br />
4.000<br />
2.000<br />
0<br />
16.567<br />
Empresa<br />
Unipersonal<br />
1.970<br />
Sociedad <strong>de</strong><br />
Responsabilidad<br />
Limitada<br />
10<br />
5<br />
Sociedad<br />
Anónima<br />
Tipo Societario<br />
34<br />
Resto <strong>de</strong> tipos<br />
societarios<br />
1.4 Base Empresarial Activa por actividad económica<br />
Por actividad económica, la Base Empresarial Activa a enero <strong>de</strong>l <strong>2013</strong> contó con 25.485 empresas <strong>de</strong>dicadas<br />
al comercio al por mayor y menor con una participación <strong>de</strong>l 36%; 10.848 inmobiliarias, empresariales y <strong>de</strong><br />
alquiler con una participación <strong>de</strong>l 15% y 10.480 empresas constructoras con una participación <strong>de</strong>l 15%. Ver<br />
cuadro Nº 5 y gráfico N° 10.<br />
Cuadro N° 5<br />
Bolivia: Base Empresarial Activa por gestión según actividad económica, 2008 – <strong>2013</strong>(1)<br />
SECCIÓN ACTIVIDAD<br />
G<br />
TOTAL<br />
Comercio al por mayor y al por menor; reparación <strong>de</strong> vehículos<br />
automotores, motocicletas, efectos personales y enseres<br />
domésticos<br />
2008 2009 2010 2011 2012 <strong>2013</strong>(1) 2008 2009 2010 2011 2012 <strong>2013</strong>(1)<br />
7.076 10.758 14.332 16.978 24.266 25.485 23% 29% 33% 33% 36% 36%<br />
K Activida<strong>de</strong>s inmobiliarias, empresariales y <strong>de</strong> alquiler 5.375 5.830 5.964 7.860 10.358 10.848 18% 16% 14% 15% 15% 15%<br />
F Construcción 4.847 5.850 6.950 8.435 10.060 10.480 16% 16% 16% 16% 15% 15%<br />
D Industria manufacturera 4.144 3.946 4.296 5.460 6.903 7.312 14% 11% 10% 11% 10% 10%<br />
I Transporte, almacenamiento y comunicaciones 4.117 5.360 5.662 5.883 6.721 7.122 14% 14% 13% 11% 10% 10%<br />
H Hoteles y restaurantes 1.246 1.562 1.665 2.121 3.342 3.556 4% 4% 4% 4% 5% 5%<br />
O Servicios comunitarios, sociales y personales 849 935 946 1.218 1.719 1.838 3% 3% 2% 2% 3% 3%<br />
N Servicios sociales y <strong>de</strong> salud 628 819 787 971 1.450 1.529 2% 2% 2% 2% 2% 2%<br />
C Explotación <strong>de</strong> minas y canteras 648 704 661 841 990 1.021 2% 2% 2% 2% 1% 1%<br />
A Agricultura, gana<strong>de</strong>ria, caza y silvicultura 491 602 592 696 907 961 2% 2% 1% 1% 1% 1%<br />
M Educación 509 584 652 745 866 912 2% 2% 2% 1% 1% 1%<br />
J Intermediación financiera 270 305 342 428 574 604 1% 1% 1% 1% 1% 1%<br />
E Suministro <strong>de</strong> electricidad, gas y agua 73 69 70 67 70 72 0% 0% 0% 0% 0% 0%<br />
B Pesca 4 1 2 5 6 8 0% 0% 0% 0% 0% 0%<br />
Fuente: FUNDEMPRESA<br />
(1): Datos al mes <strong>de</strong> enero <strong>de</strong> <strong>2013</strong><br />
CANTIDAD DE EMPRESAS COMPOSICIÓN EN PORCENTAJE<br />
30.277 37.325 42.921 51.708 68.232 71.748 100% 100% 100% 100% 100% 100%