Enero de 2013 - Fundempresa
Enero de 2013 - Fundempresa
Enero de 2013 - Fundempresa

Create successful ePaper yourself
Turn your PDF publications into a flip-book with our unique Google optimized e-Paper software.
Estadísticas <strong>de</strong>l Registro <strong>de</strong> Comercio <strong>de</strong> Bolivia<br />
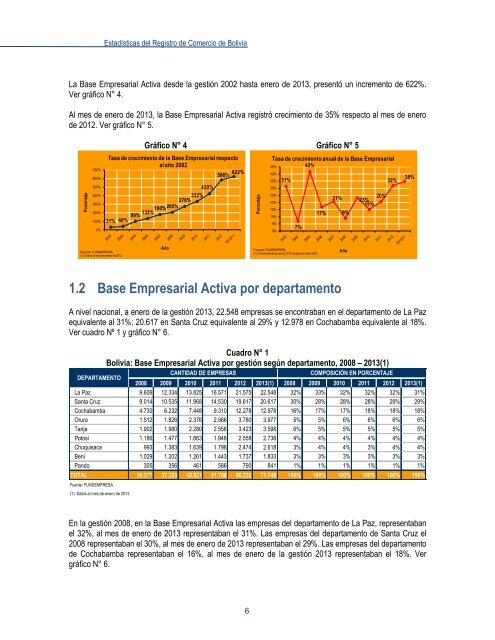
La Base Empresarial Activa <strong>de</strong>s<strong>de</strong> la gestión 2002 hasta enero <strong>de</strong> <strong>2013</strong>, presentó un incremento <strong>de</strong> 622%.<br />
Ver gráfico N° 4.<br />
Al mes <strong>de</strong> enero <strong>de</strong> <strong>2013</strong>, la Base Empresarial Activa registró crecimiento <strong>de</strong> 35% respecto al mes <strong>de</strong> enero<br />
<strong>de</strong> 2012. Ver gráfico N° 5.<br />
Porcentaje<br />
700%<br />
600%<br />
500%<br />
400%<br />
300%<br />
200%<br />
100%<br />
0%<br />
Fuente: FUNDEMPRESA<br />
(1): Datos al mes <strong>de</strong> enero <strong>de</strong> <strong>2013</strong><br />
132%180%205%<br />
99%<br />
31% 40%<br />
Gráfico N° 4 Gráfico N° 5<br />
586% 622%<br />
Tasa <strong>de</strong> crecimiento <strong>de</strong> la Base Empresarial respecto<br />
al año 2002<br />
Año<br />
276% 332%<br />
420%<br />
6<br />
Porcentaje<br />
Tasa <strong>de</strong> crecimiento anual <strong>de</strong> la Base Empresarial<br />
42%<br />
45%<br />
40%<br />
35%<br />
30%<br />
25%<br />
20%<br />
15%<br />
10%<br />
5%<br />
0%<br />
31%<br />
7%<br />
Fuente: FUNDEMPRESA<br />
(1): Crecimie4nto <strong>de</strong> enero <strong>2013</strong> respecto a enero 2012<br />
1.2 Base Empresarial Activa por <strong>de</strong>partamento<br />
17%<br />
21%<br />
9%<br />
Año<br />
20%<br />
23%<br />
15%<br />
A nivel nacional, a enero <strong>de</strong> la gestión <strong>2013</strong>, 22.548 empresas se encontraban en el <strong>de</strong>partamento <strong>de</strong> La Paz<br />
equivalente al 31%; 20.617 en Santa Cruz equivalente al 29% y 12.978 en Cochabamba equivalente al 18%.<br />
Ver cuadro Nº 1 y gráfico N° 6.<br />
DEPARTAMENTO<br />
Cuadro N° 1<br />
Bolivia: Base Empresarial Activa por gestión según <strong>de</strong>partamento, 2008 – <strong>2013</strong>(1)<br />
2008 2009 2010 2011 2012 <strong>2013</strong>(1) 2008 2009 2010 2011 2012 <strong>2013</strong>(1)<br />
La Paz 9.606 12.334 13.825 16.571 21.575 22.548 32% 33% 32% 32% 32% 31%<br />
Santa Cruz 9.014 10.535 11.968 14.530 19.617 20.617 30% 28% 28% 28% 29% 29%<br />
Cochabamba 4.730 6.232 7.448 9.310 12.278 12.978 16% 17% 17% 18% 18% 18%<br />
Oruro 1.512 1.826 2.376 2.966 3.780 3.977 5% 5% 6% 6% 6% 6%<br />
Tarija 1.902 1.980 2.280 2.556 3.423 3.598 6% 5% 5% 5% 5% 5%<br />
Potosí 1.186 1.477 1.663 1.948 2.558 2.738 4% 4% 4% 4% 4% 4%<br />
Chuquisaca 993 1.383 1.639 1.798 2.474 2.618 3% 4% 4% 3% 4% 4%<br />
Beni 1.029 1.202 1.261 1.443 1.737 1.833 3% 3% 3% 3% 3% 3%<br />
Pando 305 356 461 586 790 841 1% 1% 1% 1% 1% 1%<br />
TOTAL 30.277 37.325 42.921 51.708 68.232 71.748 100% 100% 100% 100% 100% 100%<br />
Fuente: FUNDEMPRESA<br />
(1): Datos al mes <strong>de</strong> enero <strong>de</strong> <strong>2013</strong><br />
CANTIDAD DE EMPRESAS COMPOSICIÓN EN PORCENTAJE<br />
En la gestión 2008, en la Base Empresarial Activa las empresas <strong>de</strong>l <strong>de</strong>partamento <strong>de</strong> La Paz, representaban<br />
el 32%, al mes <strong>de</strong> enero <strong>de</strong> <strong>2013</strong> representaban el 31%. Las empresas <strong>de</strong>l <strong>de</strong>partamento <strong>de</strong> Santa Cruz el<br />
2008 representaban el 30%, al mes <strong>de</strong> enero <strong>de</strong> <strong>2013</strong> representaban el 29%. Las empresas <strong>de</strong>l <strong>de</strong>partamento<br />
<strong>de</strong> Cochabamba representaban el 16%, al mes <strong>de</strong> enero <strong>de</strong> la gestión <strong>2013</strong> representaban el 18%. Ver<br />
gráfico N° 6.<br />
32%<br />
35%