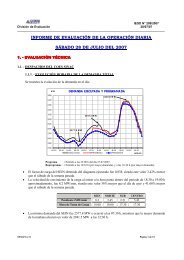
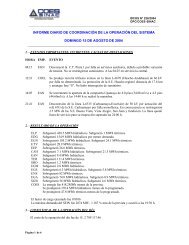
El Cuadro N°4.4 muestra la evolución anual del consumo de combustibles liquido para el período 1991- 2005. El Cuadro N°4.5 muestra el consumo de gas natural a partir de 1997 y carbón a partir del 2000. En los Cuadros N°4.6 se muestran los costos de combustibles (US$/barril, US$/MPC y US$/ t según sea el caso) de las diferentes centrales termoeléctricas vigentes al último día de cada mes. El cuadro Nº4.7 y el grafico N°4.6 presentan el costo variable de las centrales termoeléctricas del SEIN en valores nominales actualizados a Diciembre de 2005. La eficiencia termica de conversión de las unidades termoelectricas presentada en el cuadro N°4.7 provienen de las pruebas de Potencia Efectiva. ÃÃ ÃÃ ÃÃÃÃÃ (En miles de galones) Año ElectroperúEdegel Etevensa Egenor Shougesa Eepsa Cahua Egasa Enersur Egesur Egemsa San Gaban Total (1) 1991 455,7 9 420,4 16 773,6 26 649,7 1992 13 309,2 34 324,1 12 691,8 60 325,1 1993 4 433,3 20 807,7 8 648,1 3 695,5 9 567,6 211,4 89,5 47 453,1 1994 4 872,6 13 173,4 25 406,1 6 464,7 65,5 5,2 44,8 50 032,3 1995 2 888,1 7 992,4 51 093,2 12 722,2 4 896,8 470,7 29,2 80 092,6 1996 375,2 7 992,4 23 439,6 17 265,7 17 788,4 7 708,8 77,8 74 647,9 1997 0,0 33 583,7 59 845,2 16 953,4 13 332,4 157,3 6 464,7 29 724,9 6 365,4 29,1 166 456,0 1998 0,0 2 339,4 26 673,4 2 949,1 9 600,1 465,9 873,4 29 475,9 66 909,0 7 443,9 8 055,4 154 785,5 1999 714,5 4 749,1 2 664,9 1 416,4 187,0 0,0 1 292,1 33 057,5 69 658,1 9 482,9 4 884,7 4 545,2 132 652,4 2000 601,8 2 045,9 212,4 1 068,0 137,6 0,0 996,3 7 509,1 52 378,2 6 154,4 205,9 1 593,8 72 903,4 2001 1 288,7 1 707,1 768,9 673,7 1 041,1 27,4 669,2 1 287,6 18 049,8 2 685,0 24,8 443,9 28 667,0 2002 1182,0 1015,6 819,3 1392,6 2490,9 100,9 1169,8 1251,2 18609,5 2183,2 1,2 81,6 30 297,9 2003 5187,2 1495,1 482,3 2104,7 4663,0 0,0 1502,9 3585,4 27984,6 3841,3 2,6 346,1 51 195,3 2004 8768,1 20878,0 34050,3 10066,4 5664,3 0,0 1959,6 10999,8 38141,2 6530,6 11,1 169,6 137 239,3 2005 Nota: 7 361,7 2 018,1 434,3 5 422,6 9 284,6 0,0 373,6 7 187,2 23 862,5 5 288,2 5,6 220,7 61 459,1 (1) Combustibles líquidos: Diesel 2, R-6 y R500. Ã Ã 80 70 60 50 40 30 20 10 0 Electroperú Edegel Etevensa Egenor ÃÃ ÃÃÃÃÃÃÃ Shougesa Eepsa 1993 1994 1995 1996 1997 1998 1999 2000 2001 2002 2003 2004 2005 Estadística de Operaciones 2005 Cahua 35 Egasa Enersur Egesur Egemsa San Gaban
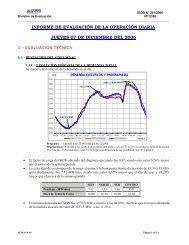
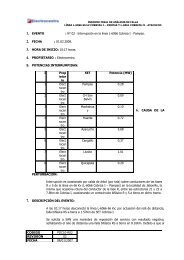
Millones de pies cúbicos. Miles de toneladas. 20000 18000 16000 14000 12000 10000 8000 6000 4000 2000 400 350 300 250 200 150 100 Estadística de Operaciones 2005 0 50 A ño Eepsa (2) Termoselva (2) Etevensa (2) Edegel (2) Enersur (3) 1997 1 543,5 1998 3 846,4 3 711,8 3 711,8 1999 6 628,3 3 900,0 3 900,0 2000 5 429,6 3 220,6 3 220,6 136,1 2001 3 944,6 5 344,9 5 344,9 122,1 2002 3072,4 8 894,9 8 894,9 307,7 2003 4 735,11 9 882,69 9 882,69 301,39 2004 6 688,23 13 096,88 4 797,23 359,48 359,48 2005 6 233,79 14 888,15 17 798,82 4 300,30 315,03 (2) Gas natural expres ado en M P C. (3 ) M iles de to neladas de carbó n 0 2000 2001 CUADR O N° 4.5 CONS UM O <strong>DE</strong> COM B US T IB LE GAS NAT UR AL Y CAR B ON E N E L S E IN 2005 (MPC) GRAFICO No 4.4 ÃÃÃÃ 2002 2003 Ã GRAFICO No 4.5 2004 2005 ÃÃÃÃÃ ÃÃ Eepsa (2) Termoselva (2) Etevensa (2) Edegel (2) 1997 1998 1999 2000 2001 2002 2003 2004 2005 36