Uniformidad de distribución del riego por goteo en vid - VI Jornadas ...
Uniformidad de distribución del riego por goteo en vid - VI Jornadas ...
Uniformidad de distribución del riego por goteo en vid - VI Jornadas ...

You also want an ePaper? Increase the reach of your titles
YUMPU automatically turns print PDFs into web optimized ePapers that Google loves.
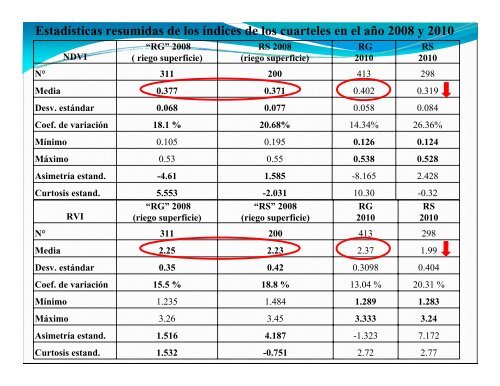
Estadísticas resumidas <strong>de</strong> los índices <strong>de</strong> los cuarteles <strong>en</strong> el año 2008 y 2010<br />
ND<strong>VI</strong><br />
“RG” 2008<br />
( <strong>riego</strong> superficie)<br />
RS 2008<br />
(<strong>riego</strong> superficie)<br />
RG<br />
2010<br />
N° 311 200 413 298<br />
RS<br />
2010<br />
Media 0.377 0.371 0.402 0.319<br />
Desv. estándar 0.068 0.077 0.058 0.084<br />
Coef. <strong>de</strong> variación 18.1 % 20.68% 14.34% 26.36%<br />
Mínimo 0.105 0.195 0.126 0.124<br />
Máximo 0.53 0.55 0.538 0.528<br />
Asimetría estand. -4.61 1.585 -8.165 2.428<br />
Curtosis estand. 5.553 -2.031 10.30 -0.32<br />
R<strong>VI</strong><br />
“RG” 2008<br />
(<strong>riego</strong> superficie)<br />
“RS” 2008<br />
(<strong>riego</strong> superficie)<br />
RG<br />
2010<br />
N° 311 200 413 298<br />
Media 2.25 2.23 2.37 1.99<br />
RS<br />
2010<br />
Desv. estándar 0.35 0.42 0.3098 0.404<br />
Coef. <strong>de</strong> variación 15.5 % 18.8 % 13.04 % 20.31 %<br />
Mínimo 1.235 1.484 1.289 1.283<br />
Máximo 3.26 3.45 3.333 3.24<br />
Asimetría estand. 1.516 4.187 -1.323 7.172<br />
Curtosis estand. 1.532 -0.751 2.72 2.77