

Descargar Nº 13 - Revista Gestión de las Personas y Tecnología
Descargar Nº 13 - Revista Gestión de las Personas y Tecnología
Descargar Nº 13 - Revista Gestión de las Personas y Tecnología

You also want an ePaper? Increase the reach of your titles
YUMPU automatically turns print PDFs into web optimized ePapers that Google loves.
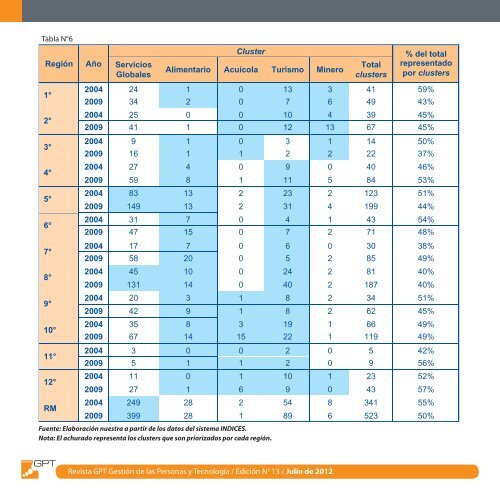
Tabla N°6<br />
Región Año Servicios<br />
Globales<br />
1°<br />
2°<br />
3°<br />
4°<br />
5°<br />
6°<br />
7°<br />
8°<br />
9°<br />
10°<br />
11°<br />
12°<br />
RM<br />
Cluster<br />
Alimentario Acuícola Turismo Minero<br />
<strong>Revista</strong> GPT <strong>Gestión</strong> <strong>de</strong> <strong>las</strong> <strong>Personas</strong> y <strong>Tecnología</strong> / Edición N° <strong>13</strong> / Julio <strong>de</strong> 2012<br />
Total<br />
clusters<br />
% <strong>de</strong>l total<br />
representado<br />
por clusters<br />
2004 24 1 0 <strong>13</strong> 3 41 59%<br />
2009 34 2 0 7 6 49 43%<br />
2004 25 0 0 10 4 39 45%<br />
2009 41 1 0 12 <strong>13</strong> 67 45%<br />
2004 9 1 0 3 1 14 50%<br />
2009 16 1 1 2 2 22 37%<br />
2004 27 4 0 9 0 40 46%<br />
2009 59 8 1 11 5 84 53%<br />
2004 83 <strong>13</strong> 2 23 2 123 51%<br />
2009 149 <strong>13</strong> 2 31 4 199 44%<br />
2004 31 7 0 4 1 43 54%<br />
2009 47 15 0 7 2 71 48%<br />
2004 17 7 0 6 0 30 38%<br />
2009 58 20 0 5 2 85 49%<br />
2004 45 10 0 24 2 81 40%<br />
2009 <strong>13</strong>1 14 0 40 2 187 40%<br />
2004 20 3 1 8 2 34 51%<br />
2009 42 9 1 8 2 62 45%<br />
2004 35 8 3 19 1 66 49%<br />
2009 67 14 15 22 1 119 49%<br />
2004 3 0 0 2 0 5 42%<br />
2009 5 1 1 2 0 9 56%<br />
2004 11 0 1 10 1 23 52%<br />
2009 27 1 6 9 0 43 57%<br />
2004 249 28 2 54 8 341 55%<br />
2009 399 28 1 89 6 523 50%<br />
Fuente: Elaboración nuestra a partir <strong>de</strong> los datos <strong>de</strong>l sistema INDICES.<br />
Nota: El achurado representa los clusters que son priorizados por cada región.<br />
Lo más interesante <strong>de</strong> esta tabla es la priorización que cada región<br />
hace <strong>de</strong> los clusters (CORFO, 2010). De aquí se <strong>de</strong>spren<strong>de</strong>, por<br />
ejemplo, que mientras los clusters acuícola y minero se concentran<br />
geográficamente en los extremos <strong>de</strong>l país, los clusters alimentario y<br />
turismo se encuentran indistintamente en casi todas <strong>las</strong> regiones, y<br />
el <strong>de</strong> servicios globales está presente exclusivamente en los gran<strong>de</strong>s<br />
centros urbanos.<br />
Asimismo, llama la atención que en todas <strong>las</strong> regiones, y tanto para<br />
el 2004 como para el 2009, el cluster <strong>de</strong> servicios globales concentra<br />
la mayor cantidad <strong>de</strong> oferta. Si se consi<strong>de</strong>ra, a<strong>de</strong>más, que sólo tres<br />
regiones priorizan este cluster, es más llamativo aún.<br />
Con dos excepciones, el cluster acuícola presenta una oferta muy<br />
Tabla N°7<br />
Región Año Servicios<br />
Globales<br />
1°<br />
2°<br />
3°<br />
4°<br />
5°<br />
6°<br />
7°<br />
8°<br />
9°<br />
Cluster<br />
www.revistagpt.usach.cl<br />
baja o inexistente, incluso en aquel<strong>las</strong> regiones que lo señalan como<br />
prioritario. Las regiones que priorizaron el cluster alimentario, por<br />
su parte, presentan situaciones disímiles.<br />
El cluster turismo <strong>de</strong> intereses especiales es priorizado por todas <strong>las</strong><br />
regiones, con excepción <strong>de</strong> dos. Sin embargo, no presenta un nivel<br />
homogéneo <strong>de</strong> la oferta. El sector minero, en tanto, es el cluster<br />
que menos regiones priorizaron; cuatro <strong>de</strong> <strong>las</strong> trece. Se ubica en el<br />
extremo norte y en la región más austral <strong>de</strong>l país y, con excepción<br />
<strong>de</strong> esta última, presenta un crecimiento importante para el período<br />
2004-2009.<br />
En cuanto a la <strong>de</strong>manda, en términos generales, se observa<br />
concordancia con la concentración <strong>de</strong> la oferta en los gran<strong>de</strong>s<br />
centros urbanos antes mencionada.<br />
Alimentario Acuícola Turismo Minero<br />
Total<br />
clusters<br />
% <strong>de</strong>l total<br />
representado<br />
por clusters<br />
2004 815 57 0 355 104 1.331 50%<br />
2009 614 63 0 302 255 1.234 31%<br />
2004 390 0 0 248 67 705 33%<br />
2009 1.016 22 0 551 530 2.119 37%<br />
2004 287 52 0 <strong>13</strong>3 58 530 47%<br />
2009 443 43 8 98 124 716 33%<br />
2004 581 152 0 312 0 1045 34%<br />
2009 1.238 297 32 662 409 2.638 36%<br />
2004 3.186 652 119 1.482 31 5.470 47%<br />
2009 4.882 626 73 1.456 2<strong>13</strong> 7.250 32%<br />
2004 458 336 0 116 74 984 36%<br />
2009 1.529 566 0 472 91 2.658 35%<br />
2004 212 228 0 352 0 792 32%<br />
2009 1.114 767 0 425 56 2.362 33%<br />
2004 1.143 252 0 1.084 0 2.479 29%<br />
2009 3.425 442 0 1.578 95 5.540 25%<br />
2004 743 187 104 363 44 1.441 43%<br />
2009 1.590 235 57 5<strong>13</strong> 107 2.502 35%<br />
Universidad <strong>de</strong> Santiago <strong>de</strong> Chile