Texto en PDF - Comunidad Virtual CIENCIAS DEL DEPORTE ...
Texto en PDF - Comunidad Virtual CIENCIAS DEL DEPORTE ...
Texto en PDF - Comunidad Virtual CIENCIAS DEL DEPORTE ...

You also want an ePaper? Increase the reach of your titles
YUMPU automatically turns print PDFs into web optimized ePapers that Google loves.
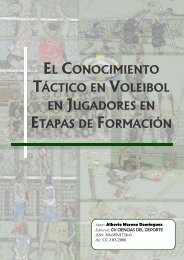
Porc<strong>en</strong>taje del tiempo empleado (%)<br />
47<br />
48<br />
49<br />
50<br />
51<br />
52<br />
53<br />
0-250 250-500<br />
Tramo (m)<br />
Finales<br />
Acceso Final<br />
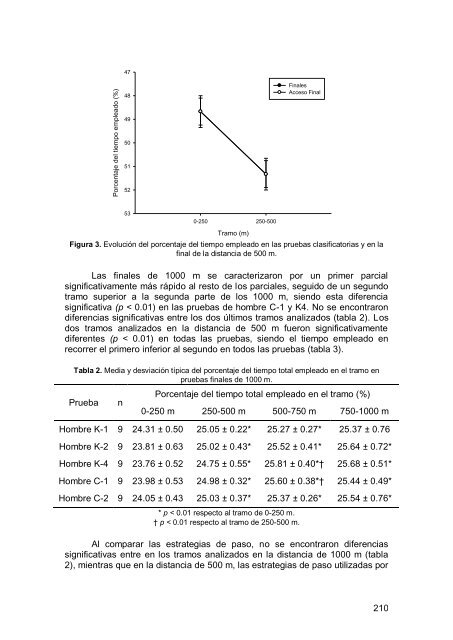
Figura 3. Evolución del porc<strong>en</strong>taje del tiempo empleado <strong>en</strong> las pruebas clasificatorias y <strong>en</strong> la<br />
final de la distancia de 500 m.<br />
Las finales de 1000 m se caracterizaron por un primer parcial<br />
significativam<strong>en</strong>te más rápido al resto de los parciales, seguido de un segundo<br />
tramo superior a la segunda parte de los 1000 m, si<strong>en</strong>do esta difer<strong>en</strong>cia<br />
significativa (p < 0.01) <strong>en</strong> las pruebas de hombre C-1 y K4. No se <strong>en</strong>contraron<br />
difer<strong>en</strong>cias significativas <strong>en</strong>tre los dos últimos tramos analizados (tabla 2). Los<br />
dos tramos analizados <strong>en</strong> la distancia de 500 m fueron significativam<strong>en</strong>te<br />
difer<strong>en</strong>tes (p < 0.01) <strong>en</strong> todas las pruebas, si<strong>en</strong>do el tiempo empleado <strong>en</strong><br />
recorrer el primero inferior al segundo <strong>en</strong> todos las pruebas (tabla 3).<br />
Tabla 2. Media y desviación típica del porc<strong>en</strong>taje del tiempo total empleado <strong>en</strong> el tramo <strong>en</strong><br />
pruebas finales de 1000 m.<br />
Prueba n<br />
Porc<strong>en</strong>taje del tiempo total empleado <strong>en</strong> el tramo (%)<br />
0-250 m 250-500 m 500-750 m 750-1000 m<br />
Hombre K-1 9 24.31 ± 0.50 25.05 ± 0.22* 25.27 ± 0.27* 25.37 ± 0.76<br />
Hombre K-2 9 23.81 ± 0.63 25.02 ± 0.43* 25.52 ± 0.41* 25.64 ± 0.72*<br />
Hombre K-4 9 23.76 ± 0.52 24.75 ± 0.55* 25.81 ± 0.40*† 25.68 ± 0.51*<br />
Hombre C-1 9 23.98 ± 0.53 24.98 ± 0.32* 25.60 ± 0.38*† 25.44 ± 0.49*<br />
Hombre C-2 9 24.05 ± 0.43 25.03 ± 0.37* 25.37 ± 0.26* 25.54 ± 0.76*<br />
* p < 0.01 respecto al tramo de 0-250 m.<br />
† p < 0.01 respecto al tramo de 250-500 m.<br />
Al comparar las estrategias de paso, no se <strong>en</strong>contraron difer<strong>en</strong>cias<br />
significativas <strong>en</strong>tre <strong>en</strong> los tramos analizados <strong>en</strong> la distancia de 1000 m (tabla<br />
2), mi<strong>en</strong>tras que <strong>en</strong> la distancia de 500 m, las estrategias de paso utilizadas por<br />
210