Directorio Nacional de Empresas Informe Anual 2008 - INE ValparaÃso
Directorio Nacional de Empresas Informe Anual 2008 - INE ValparaÃso
Directorio Nacional de Empresas Informe Anual 2008 - INE ValparaÃso

Create successful ePaper yourself
Turn your PDF publications into a flip-book with our unique Google optimized e-Paper software.
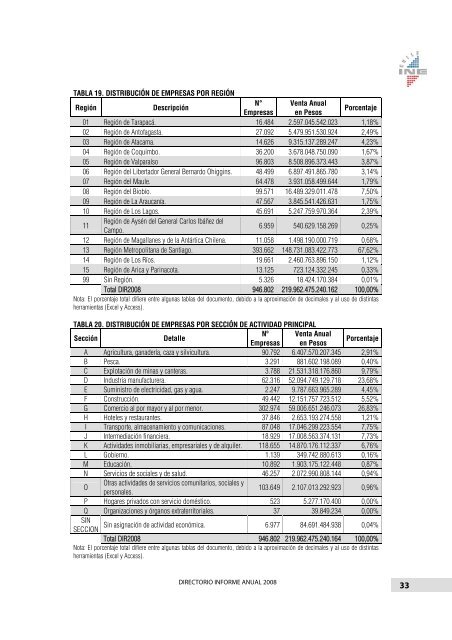
TABLA 19. DISTRIBUCIÓN DE EMPRESAS POR REGIÓN<br />
Región<br />
Descripción<br />
N° Venta <strong>Anual</strong><br />
<strong>Empresas</strong> en Pesos<br />
Porcentaje<br />
01 Región <strong>de</strong> Tarapacá. 16.484 2.597.045.542.023 1,18%<br />
02 Región <strong>de</strong> Antofagasta. 27.092 5.479.951.530.924 2,49%<br />
03 Región <strong>de</strong> Atacama. 14.626 9.315.137.289.247 4,23%<br />
04 Región <strong>de</strong> Coquimbo. 36.200 3.678.048.750.090 1,67%<br />
05 Región <strong>de</strong> Valparaíso 96.803 8.508.896.373.443 3,87%<br />
06 Región <strong>de</strong>l Libertador General Bernardo Ohiggins. 48.499 6.897.491.865.780 3,14%<br />
07 Región <strong>de</strong>l Maule. 64.478 3.931.058.499.644 1,79%<br />
08 Región <strong>de</strong>l Biobío. 99.571 16.489.329.011.478 7,50%<br />
09 Región <strong>de</strong> La Araucanía. 47.567 3.845.541.426.631 1,75%<br />
10 Región <strong>de</strong> Los Lagos. 45.691 5.247.759.970.364 2,39%<br />
11<br />
Región <strong>de</strong> Aysén <strong>de</strong>l General Carlos Ibáñez <strong>de</strong>l<br />
Campo.<br />
6.959 540.629.158.269 0,25%<br />
12 Región <strong>de</strong> Magallanes y <strong>de</strong> la Antártica Chilena. 11.058 1.498.190.000.719 0,68%<br />
13 Región Metropolitana <strong>de</strong> Santiago. 393.662 148.731.083.422.773 67,62%<br />
14 Región <strong>de</strong> Los Ríos. 19.661 2.460.763.896.150 1,12%<br />
15 Región <strong>de</strong> Arica y Parinacota. 13.125 723.124.332.245 0,33%<br />
99 Sin Región. 5.326 18.424.170.384 0,01%<br />
Total DIR<strong>2008</strong> 946.802 219.962.475.240.162 100,00%<br />
Nota: El porcentaje total difiere entre algunas tablas <strong>de</strong>l documento, <strong>de</strong>bido a la aproximación <strong>de</strong> <strong>de</strong>cimales y al uso <strong>de</strong> distintas<br />
herramientas (Excel y Access).<br />
TABLA 20. DISTRIBUCIÓN DE EMPRESAS POR SECCIÓN DE ACTIVIDAD PRINCIPAL<br />
Sección<br />
Detalle<br />
Nº Venta <strong>Anual</strong><br />
<strong>Empresas</strong> en Pesos<br />
Porcentaje<br />
A Agricultura, gana<strong>de</strong>ría, caza y silvicultura. 90.792 6.407.570.207.345 2,91%<br />
B Pesca. 3.291 881.602.198.089 0,40%<br />
C Explotación <strong>de</strong> minas y canteras. 3.788 21.531.318.176.860 9,79%<br />
D Industria manufacturera. 62.316 52.094.749.129.718 23,68%<br />
E Suministro <strong>de</strong> electricidad, gas y agua. 2.247 9.787.663.965.289 4,45%<br />
F Construcción. 49.442 12.151.757.723.512 5,52%<br />
G Comercio al por mayor y al por menor. 302.974 59.006.651.246.073 26,83%<br />
H Hoteles y restaurantes. 37.846 2.653.193.274.558 1,21%<br />
I Transporte, almacenamiento y comunicaciones. 87.048 17.046.299.223.554 7,75%<br />
J Intermediación financiera. 18.929 17.008.563.374.131 7,73%<br />
K Activida<strong>de</strong>s inmobiliarias, empresariales y <strong>de</strong> alquiler. 118.655 14.870.176.112.337 6,76%<br />
L Gobierno. 1.139 349.742.880.613 0,16%<br />
M Educación. 10.892 1.903.175.122.448 0,87%<br />
N Servicios <strong>de</strong> sociales y <strong>de</strong> salud. 46.257 2.072.990.808.144 0,94%<br />
O<br />
Otras activida<strong>de</strong>s <strong>de</strong> servicios comunitarios, sociales y<br />
personales.<br />
103.649 2.107.013.292.923 0,96%<br />
P Hogares privados con servicio doméstico. 523 5.277.170.400 0,00%<br />
Q Organizaciones y órganos extraterritoriales. 37 39.849.234 0,00%<br />
SIN<br />
SECCION<br />
Sin asignación <strong>de</strong> actividad económica. 6.977 84.691.484.938 0,04%<br />
Total DIR<strong>2008</strong> 946.802 219.962.475.240.164 100,00%<br />
Nota: El porcentaje total difiere entre algunas tablas <strong>de</strong>l documento, <strong>de</strong>bido a la aproximación <strong>de</strong> <strong>de</strong>cimales y al uso <strong>de</strong> distintas<br />
herramientas (Excel y Access).<br />
DIRECTORIO INFORME ANUAL <strong>2008</strong><br />
33