Edentata 11(1) - Anteater, Sloth & Armadillo Specialist Group
Edentata 11(1) - Anteater, Sloth & Armadillo Specialist Group
Edentata 11(1) - Anteater, Sloth & Armadillo Specialist Group

Create successful ePaper yourself
Turn your PDF publications into a flip-book with our unique Google optimized e-Paper software.
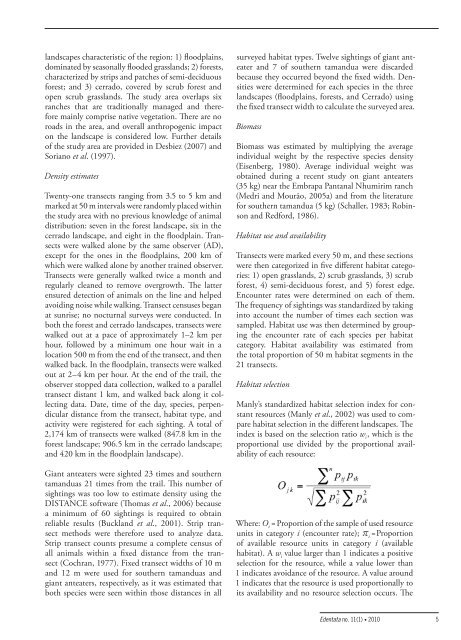
landscapes characteristic of the region: 1) floodplains,<br />
dominated by seasonally flooded grasslands; 2) forests,<br />
characterized by strips and patches of semi-deciduous<br />
forest; and 3) cerrado, covered by scrub forest and<br />
open scrub grasslands. The study area overlaps six<br />
ranches that are traditionally managed and therefore<br />
mainly comprise native vegetation. There are no<br />
roads in the area, and overall anthropogenic impact<br />
on the landscape is considered low. Further details<br />
of the study area are provided in Desbiez (2007) and<br />
Soriano et al. (1997).<br />
Density estimates<br />
Twenty-one transects ranging from 3.5 to 5 km and<br />
marked at 50 m intervals were randomly placed within<br />
the study area with no previous knowledge of animal<br />
distribution: seven in the forest landscape, six in the<br />
cerrado landscape, and eight in the floodplain. Transects<br />
were walked alone by the same observer (AD),<br />
except for the ones in the floodplains, 200 km of<br />
which were walked alone by another trained observer.<br />
Transects were generally walked twice a month and<br />
regularly cleaned to remove overgrowth. The latter<br />
ensured detection of animals on the line and helped<br />
avoiding noise while walking. Transect censuses began<br />
at sunrise; no nocturnal surveys were conducted. In<br />
both the forest and cerrado landscapes, transects were<br />
walked out at a pace of approximately 1–2 km per<br />
hour, followed by a minimum one hour wait in a<br />
location 500 m from the end of the transect, and then<br />
walked back. In the floodplain, transects were walked<br />
out at 2–4 km per hour. At the end of the trail, the<br />
observer stopped data collection, walked to a parallel<br />
transect distant 1 km, and walked back along it collecting<br />
data. Date, time of the day, species, perpendicular<br />
distance from the transect, habitat type, and<br />
activity were registered for each sighting. A total of<br />
2,174 km of transects were walked (847.8 km in the<br />
forest landscape; 906.5 km in the cerrado landscape;<br />
and 420 km in the floodplain landscape).<br />
Giant anteaters were sighted 23 times and southern<br />
tamanduas 21 times from the trail. This number of<br />
sightings was too low to estimate density using the<br />
DISTANCE software (Thomas et al., 2006) because<br />
a minimum of 60 sightings is required to obtain<br />
reliable results (Buckland et al., 2001). Strip transect<br />
methods were therefore used to analyze data.<br />
Strip transect counts presume a complete census of<br />
all animals within a fixed distance from the transect<br />
(Cochran, 1977). Fixed transect widths of 10 m<br />
and 12 m were used for southern tamanduas and<br />
giant anteaters, respectively, as it was estimated that<br />
both species were seen within those distances in all<br />
surveyed habitat types. Twelve sightings of giant anteater<br />
and 7 of southern tamandua were discarded<br />
because they occurred beyond the fixed width. Densities<br />
were determined for each species in the three<br />
landscapes (floodplains, forests, and Cerrado) using<br />
the fixed transect width to calculate the surveyed area.<br />
Biomass<br />
Biomass was estimated by multiplying the average<br />
individual weight by the respective species density<br />
(Eisenberg, 1980). Average individual weight was<br />
obtained during a recent study on giant anteaters<br />
(35 kg) near the Embrapa Pantanal Nhumirim ranch<br />
(Medri and Mourão, 2005a) and from the literature<br />
for southern tamandua (5 kg) (Schaller, 1983; Robinson<br />
and Redford, 1986).<br />
Habitat use and availability<br />
Transects were marked every 50 m, and these sections<br />
were then categorized in five different habitat categories:<br />
1) open grasslands, 2) scrub grasslands, 3) scrub<br />
forest, 4) semi-deciduous forest, and 5) forest edge.<br />
Encounter rates were determined on each of them.<br />
The frequency of sightings was standardized by taking<br />
into account the number of times each section was<br />
sampled. Habitat use was then determined by grouping<br />
the encounter rate of each species per habitat<br />
category. Habitat availability was estimated from<br />
the total proportion of 50 m habitat segments in the<br />
21 transects.<br />
Habitat selection<br />
Manly’s standardized habitat selection index for constant<br />
resources (Manly et al., 2002) was used to compare<br />
habitat selection in the different landscapes. The<br />
index is based on the selection ratio w i<br />
, which is the<br />
proportional use divided by the proportional availability<br />
of each resource:<br />
Where: O i<br />
= Proportion of the sample of used resource<br />
units in category i (encounter rate); π i<br />
= Proportion<br />
of available resource units in category i (available<br />
habitat). A w i<br />
value larger than 1 indicates a positive<br />
selection for the resource, while a value lower than<br />
1 indicates avoidance of the resource. A value around<br />
1 indicates that the resource is used proportionally to<br />
its availability and no resource selection occurs. The<br />
<strong>Edentata</strong> no. <strong>11</strong>(1) • 2010 5