Efigas S.A. ESP - Sistema Unico de Informacion de Servicios Públicos
Efigas S.A. ESP - Sistema Unico de Informacion de Servicios Públicos
Efigas S.A. ESP - Sistema Unico de Informacion de Servicios Públicos

You also want an ePaper? Increase the reach of your titles
YUMPU automatically turns print PDFs into web optimized ePapers that Google loves.
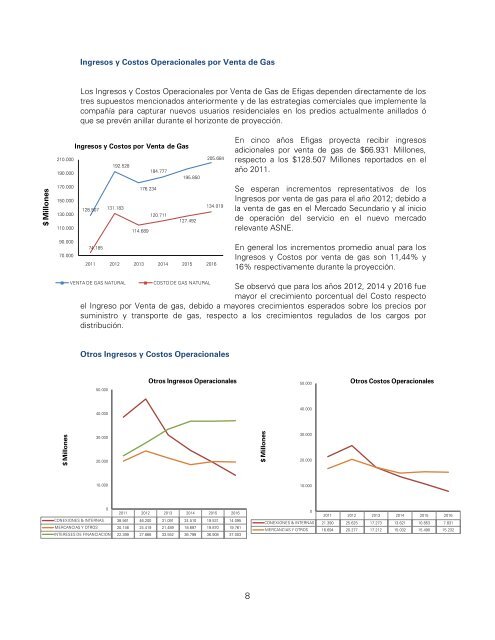
Ingresos y Costos Operacionales por Venta <strong>de</strong> Gas<br />
Los Ingresos y Costos Operacionales por Venta <strong>de</strong> Gas <strong>de</strong> <strong>Efigas</strong> <strong>de</strong>pen<strong>de</strong>n directamente <strong>de</strong> los<br />
tres supuestos mencionados anteriormente y <strong>de</strong> las estrategias comerciales que implemente la<br />
compañía para capturar nuevos usuarios resi<strong>de</strong>nciales en los predios actualmente anillados ó<br />
que se prevén anillar durante el horizonte <strong>de</strong> proyección.<br />
Ingresos y Costos por Venta <strong>de</strong> Gas<br />
210.000<br />
192.528<br />
190.000<br />
184.777<br />
195.850<br />
205.684<br />
En cinco años <strong>Efigas</strong> proyecta recibir ingresos<br />
adicionales por venta <strong>de</strong> gas <strong>de</strong> $66.931 Millones,<br />
respecto a los $128.507 Millones reportados en el<br />
año 2011.<br />
$ Millones<br />
170.000<br />
150.000<br />
130.000<br />
110.000<br />
128.507<br />
131.183<br />
176.234<br />
120.711<br />
114.689<br />
127.492<br />
134.019<br />
Se esperan incrementos representativos <strong>de</strong> los<br />
Ingresos por venta <strong>de</strong> gas para el año 2012; <strong>de</strong>bido a<br />
la venta <strong>de</strong> gas en el Mercado Secundario y al inicio<br />
<strong>de</strong> operación <strong>de</strong>l servicio en el nuevo mercado<br />
relevante ASNE.<br />
90.000<br />
70.000<br />
74.185<br />
2011 2012 2013 2014 2015 2016<br />
En general los incrementos promedio anual para los<br />
Ingresos y Costos por venta <strong>de</strong> gas son 11,44% y<br />
16% respectivamente durante la proyección.<br />
VENTA DE GAS NATURAL<br />
COSTO DE GAS NATURAL<br />
Se observó que para los años 2012, 2014 y 2016 fue<br />
mayor el crecimiento porcentual <strong>de</strong>l Costo respecto<br />
el Ingreso por Venta <strong>de</strong> gas, <strong>de</strong>bido a mayores crecimientos esperados sobre los precios por<br />
suministro y transporte <strong>de</strong> gas, respecto a los crecimientos regulados <strong>de</strong> los cargos por<br />
distribución.<br />
Otros Ingresos y Costos Operacionales<br />
50.000<br />
Otros Ingresos Operacionales<br />
50.000<br />
Otros Costos Operacionales<br />
40.000<br />
40.000<br />
$ Millones<br />
30.000<br />
20.000<br />
$ Millones<br />
30.000<br />
20.000<br />
10.000<br />
10.000<br />
0<br />
2011 2012 2013 2014 2015 2016<br />
CONEXIONES & INTERNAS 38.561 46.200 31.091 24.510 19.531 14.095<br />
MERCANCIAS Y OTROS 20.146 24.419 21.489 18.697 19.870 19.761<br />
INTERESES DE FINANCIACION 22.399 27.666 33.552 36.799 36.908 37.003<br />
0<br />
2011 2012 2013 2014 2015 2016<br />
CONEXIONES & INTERNAS 21.390 25.625 17.273 13.621 10.853 7.831<br />
MERCANCIAS Y OTROS 16.694 20.277 17.212 15.032 15.490 15.232<br />
8