Veraguas - ContralorÃa General de la República
Veraguas - ContralorÃa General de la República
Veraguas - ContralorÃa General de la República

Create successful ePaper yourself
Turn your PDF publications into a flip-book with our unique Google optimized e-Paper software.
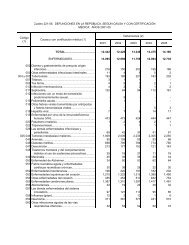
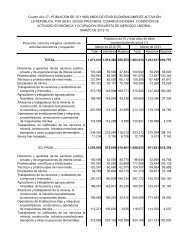
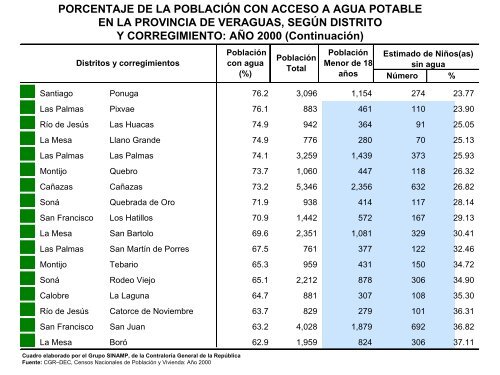
PORCENTAJE DE LA POBLACIÓN CON ACCESO A AGUA POTABLE<br />
EN LA PROVINCIA DE VERAGUAS, SEGÚN DISTRITO<br />
Y CORREGIMIENTO: AÑO 2000 (Continuación)<br />
Distritos y corregimientos<br />
Cuadro e<strong>la</strong>borado por el Grupo SINAMP, <strong>de</strong> <strong>la</strong> Contraloría <strong>General</strong> <strong>de</strong> <strong>la</strong> República<br />
Fuente: CGR–DEC, Censos Nacionales <strong>de</strong> Pob<strong>la</strong>ción y Vivienda: Año 2000<br />
Pob<strong>la</strong>ción<br />
con agua<br />
(%)<br />
Pob<strong>la</strong>ción<br />
Total<br />
Pob<strong>la</strong>ción<br />
Menor <strong>de</strong> 18<br />
años<br />
Estimado <strong>de</strong> Niños(as)<br />
sin agua<br />
Número %<br />
Santiago Ponuga 76.2 3,096 1,154 274 23.77<br />
Las Palmas Pixvae 76.1 883 461 110 23.90<br />
Río <strong>de</strong> Jesús Las Huacas 74.9 942 364 91 25.05<br />
La Mesa L<strong>la</strong>no Gran<strong>de</strong> 74.9 776 280 70 25.13<br />
Las Palmas Las Palmas 74.1 3,259 1,439 373 25.93<br />
Montijo Quebro 73.7 1,060 447 118 26.32<br />
Cañazas Cañazas 73.2 5,346 2,356 632 26.82<br />
Soná Quebrada <strong>de</strong> Oro 71.9 938 414 117 28.14<br />
San Francisco Los Hatillos 70.9 1,442 572 167 29.13<br />
La Mesa San Bartolo 69.6 2,351 1,081 329 30.41<br />
Las Palmas San Martín <strong>de</strong> Porres 67.5 761 377 122 32.46<br />
Montijo Tebario 65.3 959 431 150 34.72<br />
Soná Ro<strong>de</strong>o Viejo 65.1 2,212 878 306 34.90<br />
Calobre La Laguna 64.7 881 307 108 35.30<br />
Río <strong>de</strong> Jesús Catorce <strong>de</strong> Noviembre 63.7 829 279 101 36.31<br />
San Francisco San Juan 63.2 4,028 1,879 692 36.82<br />
La Mesa Boró 62.9 1,959 824 306 37.11