Veraguas - ContralorÃa General de la República
Veraguas - ContralorÃa General de la República
Veraguas - ContralorÃa General de la República

Create successful ePaper yourself
Turn your PDF publications into a flip-book with our unique Google optimized e-Paper software.
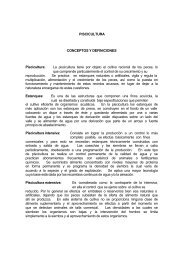
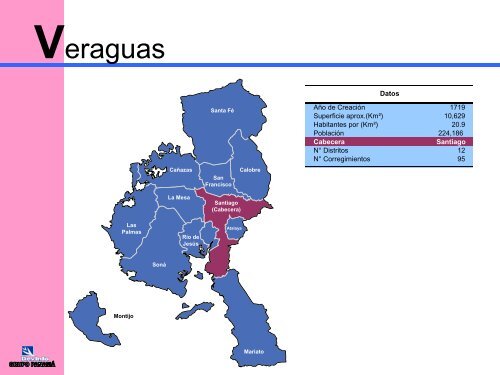
<strong>Veraguas</strong><br />
Cañazas<br />
Santa Fé<br />
San<br />
Francisco<br />
Calobre<br />
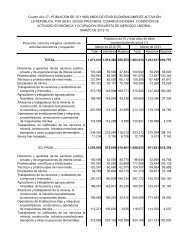
Datos<br />
Año <strong>de</strong> Creación 1719<br />
Superficie aprox.(Km²) 10,629<br />
Habitantes por (Km²) 20.9<br />
Pob<strong>la</strong>ción 224,186<br />
Cabecera<br />
Santiago<br />
N° Distritos 12<br />
N° Corregimientos 95<br />
La Mesa<br />
Santiago<br />
(Cabecera)<br />
Las<br />
Palmas<br />
Río <strong>de</strong><br />
Jesús<br />
Ata<strong>la</strong>ya<br />
Soná<br />
Montijo<br />
Mariato
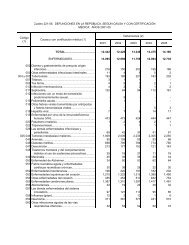
ESTIMACIÓN DE LA POBLACIÓN EN LA PROVINCIA DE VERAGUAS, POR SEXO,<br />
SEGÚN DISTRITO Y CORREGIMIENTO: AÑO 2006<br />
Distrito y corregimiento Total Hombres Mujeres Distrito y corregimiento Total Hombres Mujeres<br />
TOTAL<br />
Cuadro e<strong>la</strong>borado por el Grupo SINAMP, <strong>de</strong> <strong>la</strong> Contraloría <strong>General</strong> <strong>de</strong> <strong>la</strong> República<br />
Fuente: CGR-DEC, Sección <strong>de</strong> Análisis Demográfico.<br />
224,186 118,121 106,065 Cañazas 16,745 9,379 7,366<br />
Ata<strong>la</strong>ya 9,709 5,116 4,593 Cañazas (Cabecera) 6,199 3,586 2,613<br />
Ata<strong>la</strong>ya (Cabecera) 4,811 2,501 2,310 Cerro P<strong>la</strong>ta 1,562 878 684<br />
El Barrito 925 502 423 El Picador 3,147 1,716 1,431<br />
La Montañue<strong>la</strong> 764 422 342 Los Valles 977 416 561<br />
La Carrillo 756 439 317 San José 1,808 1,022 786<br />
San Antonio 2,453 1,252 1,201 San Marcelo 1,237 716 521<br />
El Aromillo 1,815 1,045 770<br />
Calobre 12,846 6,787 6,059<br />
Calobre (Cabecera) 3,047 1,590 1,457 La Mesa 12,392 6,710 5,682<br />
Barnizal 517 274 243 La Mesa (Cabecera) 4,111 2,149 1,962<br />
Chitra 1,585 841 744 Bisvalles 2,097 1,156 941<br />
El Coc<strong>la</strong> 608 363 245 Boró 1,901 1,068 833<br />
El Potrero 661 351 310 L<strong>la</strong>no Gran<strong>de</strong> 806 434 372<br />
La Laguna 880 488 392 San Bartolo 2,408 1,318 1,090<br />
La Raya <strong>de</strong> Calobre 521 278 243 Los Mi<strong>la</strong>gros 1,069 585 484<br />
La Tetil<strong>la</strong> 393 202 191<br />
La Yeguada 1,519 771 748 La Palmas 18,766 10,183 8,583<br />
Las Guías j<br />
1,800 934 866 Las Palmas (Cabecera) 3,087 1,618 1,469<br />
San José 727 388 339 Corozal 1,122 611 511
ESTIMACIÓN DE LA POBLACIÓN EN LA PROVINCIA DE VERAGUAS, POR SEXO,<br />
SEGÚN DISTRITO Y CORREGIMIENTO: AÑO 2006 (Continuación)<br />
Distrito y corregimiento Total Hombres Mujeres Distrito y corregimiento Total Hombres Mujeres<br />
El María 1,493 841 652 Río <strong>de</strong> Jesús 5,591 3,105 2,486<br />
El Prado 1,161 623 538 Río <strong>de</strong> Jesús (Cabecera) 2,931 1,605 1,326<br />
El Rincón 2,692 1,478 1,214 Las Huacas 934 546 388<br />
Lolá 1,145 670 475 Los Castillos 620 345 275<br />
Pixvae 873 476 397 Utira 299 156 143<br />
Puerto Vidal 1,827 981 846 Catorce <strong>de</strong> Noviembre 807 453 354<br />
San Martín <strong>de</strong> Porres 764 376 388<br />
Viguí 990 519 471 San Francisco 10,380 5,618 4,762<br />
Zapotillo 1,231 689 542 San Francisco (Cabecera) 2,399 1,235 1,164<br />
Corral Falso 411 220 191<br />
Montijo 7,060 3,760 3,300 Los Hatillos 1,482 846 636<br />
Montijo (Cabecera) 2,542 1,300 1,242 Remance 1,868 1,054 814<br />
Gobernadora 625 463 162 San Juan 2,086 1,127 959<br />
La Garceana 266 172 94 San José 2,134 1,136 998<br />
Leones 308 167 141<br />
Pilón 567 283 284 Santa Fé 13,571 7,628 5,943<br />
Unión <strong>de</strong>l Norte 617 280 337 Santa Fé (Cabecera) 2,951 1,655 1,296<br />
Costa Hermosa 1,570 779 791 Calovébora 2,514 1,374 1,140<br />
Cébaco 565 316 249 El Alto y<br />
2,126 1,202 924<br />
Cuadro e<strong>la</strong>borado por el Grupo SINAMP, <strong>de</strong> <strong>la</strong> Contraloría <strong>General</strong> <strong>de</strong> <strong>la</strong> República<br />
Fuente: CGR-DEC, Sección <strong>de</strong> Análisis Demográfico.<br />
El Pantano 698 391 307
ESTIMACIÓN DE LA POBLACIÓN EN LA PROVINCIA DE VERAGUAS, POR SEXO,<br />
SEGÚN DISTRITO Y CORREGIMIENTO: AÑO 2006 (Conclusión)<br />
Distrito y corregimiento Total Hombres Mujeres Distrito y corregimiento Total Hombres Mujeres<br />
Gatún o Gatuncito 1,787 1,033 754 Bahía Honda 1,332 686 646<br />
Río Luis 1,835 1,025 810 Calidonia 1,434 764 670<br />
Cativá 878 452 426<br />
Santiago 82,557 42,289 40,268 El Marañón 2,411 1,222 1,189<br />
Santiago (Cabecera) 27,359 13,925 13,434 Guarumal 3,424 1,735 1,689<br />
La Colorada 2,237 1,165 1,072 La Soledad 1,646 829 817<br />
La Peña 4,146 2,183 1,963 Quebrada <strong>de</strong> Oro 961 497 464<br />
La Raya <strong>de</strong> Santa María 3,409 1,822 1,587 Río Gran<strong>de</strong> 3,435 1,785 1,650<br />
Ponuga 3,156 1,797 1,359 Ro<strong>de</strong>o Viejo 2,247 1,213 1,034<br />
San Pedro <strong>de</strong>l Espino 1,575 859 716<br />
Canto <strong>de</strong>l L<strong>la</strong>no 11,950 5,879 6,071 Mariato 5,805 3,261 2,544<br />
Los Algarrobos 5,066 2,703 2,363 L<strong>la</strong>no <strong>de</strong> Catival (Cabecera) 2,457 1,363 1,094<br />
Carlos Santana Ávi<strong>la</strong> 3,893 2,012 1,881 Arenas 597 342 255<br />
Edwin Fábrega 3,007 1,572 1,435 El Cacao 502 306 196<br />
San Martín <strong>de</strong> Porres 14,923 7,363 7,560 Quebro 1,111 613 498<br />
Urracá 1,836 1,009 827 Tebario 1,138 637 501<br />
Soná 28,764 14,285 14,479<br />
Soná (Cabecera) 10,996 5,102 5,894<br />
Cuadro e<strong>la</strong>borado por el Grupo SINAMP, <strong>de</strong> <strong>la</strong> Contraloría <strong>General</strong> <strong>de</strong> <strong>la</strong> República<br />
Fuente: CGR-DEC, Sección <strong>de</strong> Análisis Demográfico.
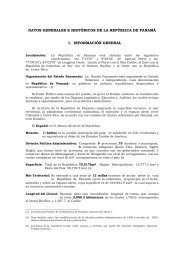
ESTIMACIÓN DE LA POBLACIÓN MENOR DE 18 AÑOS DE EDAD<br />
EN LA PROVINCIA DE VERAGUAS, POR SEXO,<br />
SEGÚN DISTRITO: AÑO 2006<br />
Distrito Total Hombres Mujeres<br />
Menores <strong>de</strong> 18 años <strong>de</strong> edad<br />
TOTAL<br />
83,930 42,872 41,058<br />
Ata<strong>la</strong>ya 3,222 1,723 1,499<br />
Calobre 4,887 2,478 2,409<br />
Cañaza 7,201 3,800 3,401<br />
La Mesa 4,640 2,416 2,224<br />
Las Palmas 8,184 4,293 3,891<br />
Mariato 2,238 1,181 1,057<br />
Montijo 2,427 1,196 1,231<br />
Río <strong>de</strong> Jesús 1,821 933 888<br />
San Francisco 4,143 2,135 2,008<br />
Santa Fe 6,214 3,285 2,929<br />
Santiago 27,585 14,057 13,528<br />
Soná 11,368 5,375 5,993<br />
Cuadro e<strong>la</strong>borado por el Grupo SINAMP, <strong>de</strong> <strong>la</strong> Contraloría <strong>General</strong> <strong>de</strong> <strong>la</strong> República<br />
Fuente: CGR-DEC, Sección <strong>de</strong> Análisis Demográfico.
ESTIMACIÓN DE LA POBLACIÓN DE 0 A 5 AÑOS DE EDAD<br />
EN LA PROVINCIA DE VERAGUAS, POR SEXO,<br />
SEGÚN DISTRITO: AÑO 2006<br />
Distrito Total Hombres Mujeres<br />
Infancia Temprana (0 a 5 años)<br />
TOTAL<br />
28,021 14,312 13,709<br />
Ata<strong>la</strong>ya 1,035 517 518<br />
Calobre 1,709 854 855<br />
Cañaza 2,600 1,356 1,244<br />
La Mesa 1,564 801 763<br />
Las Palmas 2,832 1,422 1,410<br />
Mariato 776 391 385<br />
Montijo 798 406 392<br />
Río <strong>de</strong> Jesús 579 295 284<br />
San Francisco 1,467 736 731<br />
Santa Fe 2,328 1,211 1,117<br />
Santiago 8,693 4,623 4,070<br />
Soná 3,640 1,700 1,940<br />
Cuadro e<strong>la</strong>borado por el Grupo SINAMP, <strong>de</strong> <strong>la</strong> Contraloría <strong>General</strong> <strong>de</strong> <strong>la</strong> República<br />
Fuente: CGR-DEC, Sección <strong>de</strong> Análisis Demográfico.
ESTIMACIÓN DE LA POBLACIÓN DE 6 A 11 AÑOS DE EDAD<br />
EN LA PROVINCIA DE VERAGUAS, POR SEXO,<br />
SEGÚN DISTRITO: AÑO 2006<br />
Distrito Total Hombres Mujeres<br />
Infancia (6 a 11 años)<br />
TOTAL<br />
28,768 14,671 14,097<br />
Ata<strong>la</strong>ya 1,002 531 471<br />
Calobre 1,748 872 876<br />
Cañaza 2,518 1,288 1,230<br />
La Mesa 1,602 834 768<br />
Las Palmas 2,858 1,489 1,369<br />
Mariato 772 417 355<br />
Montijo 866 428 438<br />
Río <strong>de</strong> Jesús 631 315 316<br />
San Francisco 1,593 827 766<br />
Santa Fe 2,241 1,160 1,081<br />
Santiago 8,980 4,633 4,347<br />
Soná 3,957 1,877 2,080<br />
Cuadro e<strong>la</strong>borado por el Grupo SINAMP, <strong>de</strong> <strong>la</strong> Contraloría <strong>General</strong> <strong>de</strong> <strong>la</strong> República<br />
Fuente: CGR-DEC, Sección <strong>de</strong> Análisis Demográfico.
ESTIMACIÓN DE LA POBLACIÓN DE 12 A 17 AÑOS DE EDAD<br />
EN LA PROVINCIA DE VERAGUAS, POR SEXO,<br />
SEGÚN DISTRITO: AÑO 2006<br />
Adolescencia (12 a 17 años)<br />
Distrito Total Hombres Mujeres<br />
TOTAL<br />
27,141 13,889 13,252<br />
Ata<strong>la</strong>ya 1,185 675 510<br />
Calobre 1,430 752 678<br />
Cañaza 2,083 1,156 927<br />
La Mesa 1,474 781 693<br />
Las Palmas 2,494 1,382 1,112<br />
Mariato 690 373 317<br />
Montijo 763 362 401<br />
Río <strong>de</strong> Jesús 611 323 288<br />
San Francisco 1,083 572 511<br />
Santa Fe 1,645 914 731<br />
Santiago 9,912 4,801 5,111<br />
Soná 3,771 1,798 1,973<br />
Cuadro e<strong>la</strong>borado por el Grupo SINAMP, <strong>de</strong> <strong>la</strong> Contraloría <strong>General</strong> <strong>de</strong> <strong>la</strong> República<br />
Fuente: CGR-DEC, Sección <strong>de</strong> Análisis Demográfico.
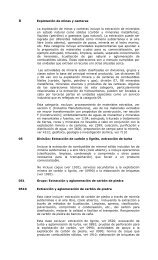
TASA DE DESERCIÓN EN EDUCACIÓN PRIMARIA EN LA PROVINCIA<br />
DE VERAGUAS: AÑOS 1991-2004<br />
3.4<br />
Definición: Total <strong>de</strong> alumnos que abandonan <strong>la</strong> escue<strong>la</strong><br />
(<strong>de</strong>sertores) antes <strong>de</strong> concluir el año académico <strong>de</strong> educación<br />
primaria.<br />
T<br />
a<br />
s<br />
a<br />
1.7 1.7<br />
2.3<br />
1.2 1.2<br />
1.9<br />
2.2<br />
1.3 1.3<br />
1.1 1.1<br />
1.4<br />
0.8<br />
1991 1992 1993 1994 1995 1996 1997 1998 1999 2000 2001 2002 2003 2004<br />
Año<br />
Gráfica e<strong>la</strong>borada por el Grupo SINAMP, <strong>de</strong> <strong>la</strong> Contraloría <strong>General</strong> <strong>de</strong> <strong>la</strong> República<br />
Fuente: CGR-DEC, Sección <strong>de</strong> Estadísticas Sociales.
TASA DE REPITENCIA DE EDUCACIÓN PRIMARIA EN LA PROVINCIA<br />
DE VERAGUAS, POR SEXO: AÑO 2004-05<br />
7.9<br />
7.8<br />
6.7<br />
6.5<br />
5.3<br />
5.0<br />
Total<br />
Hombre<br />
Mujer<br />
2004 2005<br />
Gráfica e<strong>la</strong>borada por el Grupo SINAMP, <strong>de</strong> <strong>la</strong> Contraloría <strong>General</strong> <strong>de</strong> <strong>la</strong> República<br />
Fuente: MEDUCA, Departamento <strong>de</strong> Estadística.<br />
Definición: Proporción <strong>de</strong> alumnos que se han<br />
matricu<strong>la</strong>do en el año esco<strong>la</strong>r en el mismo grado<br />
que el año esco<strong>la</strong>r anterior <strong>de</strong> <strong>la</strong> educación primaria
TASA DE REPITENCIA DE EDUCACIÓN PRIMARIA EN LA PROVINCIA<br />
DE VERAGUAS, POR SEXO: AÑO 2005<br />
6.6<br />
4.6<br />
7.8<br />
5.0<br />
5.6<br />
6.6<br />
7.8<br />
4.6 5.0<br />
6.5<br />
Nacional<br />
Gráfica e<strong>la</strong>borada por el Grupo SINAMP, <strong>de</strong> <strong>la</strong> Contraloría <strong>General</strong> <strong>de</strong> <strong>la</strong> República<br />
Fuente: MEDUCA, Departamento <strong>de</strong> Estadística.<br />
<strong>Veraguas</strong><br />
Total Hombre Mujer<br />
Definición: Proporción <strong>de</strong> alumnos que se han<br />
matricu<strong>la</strong>do en el año esco<strong>la</strong>r en el mismo grado<br />
que el año esco<strong>la</strong>r anterior <strong>de</strong> <strong>la</strong> educación primaria
TASA DE REPITENCIA DE EDUCACIÓN PREMEDIA Y MEDIA<br />
EN LA PROVINCIA DE VERAGUAS, SEGÚN SEXO:<br />
AÑO 2004-05<br />
5.1<br />
4.0<br />
2.9<br />
3.2<br />
4.0<br />
2.4<br />
Total<br />
Hombre<br />
Mujer<br />
2004 2005<br />
Gráfica e<strong>la</strong>borada por el Grupo SINAMP, <strong>de</strong> <strong>la</strong> Contraloría <strong>General</strong> <strong>de</strong> <strong>la</strong> República<br />
Fuente: MEDUCA, Departamento <strong>de</strong> Estadística.<br />
Definición: Proporción <strong>de</strong> alumnos que se han<br />
matricu<strong>la</strong>do en el año esco<strong>la</strong>r en el mismo grado que el<br />
año esco<strong>la</strong>r anterior <strong>de</strong> <strong>la</strong> educación premedia y media.
TASA DE REPITENCIA DE EDUCACIÓN PREMEDIA Y MEDIA<br />
EN LA PROVINCIA DE VERAGUAS,<br />
SEGÚN SEXO: AÑO 2005<br />
5.1<br />
6.3<br />
6.3<br />
3.9<br />
3.9<br />
3.2<br />
4.0<br />
4.0<br />
2.4<br />
2.4<br />
Nacional<br />
<strong>Veraguas</strong><br />
Total Hombre Mujer<br />
Gráfica e<strong>la</strong>borada por el Grupo SINAMP, <strong>de</strong> <strong>la</strong> Contraloría <strong>General</strong> <strong>de</strong> <strong>la</strong> República<br />
Fuente: MEDUCA, Departamento <strong>de</strong> Estadística.<br />
Definición: Proporción <strong>de</strong> alumnos que se han<br />
matricu<strong>la</strong>do en el año esco<strong>la</strong>r en el mismo grado que el<br />
año esco<strong>la</strong>r anterior <strong>de</strong> <strong>la</strong> educación premedia y media.
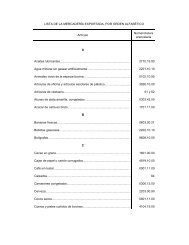
PORCENTAJE DE LA POBLACIÓN CON ACCESO A AGUA POTABLE<br />
EN LA PROVINCIA DE VERAGUAS, SEGÚN CORREGIMIENTO:<br />
AÑO 2000<br />
Río Luis<br />
Calovébora<br />
San José<br />
El<br />
Picador<br />
Cerro<br />
<strong>de</strong><br />
Casa<br />
El<br />
Prado<br />
Puerto<br />
Vidal<br />
Zapotillo<br />
Cerro<br />
P<strong>la</strong>ta<br />
El<br />
Rincón<br />
Calidonia<br />
Cativá<br />
Remance<br />
La<br />
Garceana<br />
La Tetil<strong>la</strong><br />
Bahía Honda<br />
Gobernadora<br />
Mapa e<strong>la</strong>borado por el Grupo SINAMP, <strong>de</strong> <strong>la</strong> Contraloría <strong>General</strong> <strong>de</strong> <strong>la</strong> República<br />
Fuente: CGR–DEC, Censos Nacionales <strong>de</strong> Pob<strong>la</strong>ción y Vivienda: Año 2000<br />
Mayor <strong>de</strong>l 60 %<br />
40 al 60 %<br />
Menor <strong>de</strong>l 40 %<br />
Definición: Resultado <strong>de</strong> dividir <strong>la</strong> cantidad <strong>de</strong><br />
personas que viven en viviendas particu<strong>la</strong>res<br />
ocupadas y que <strong>de</strong>c<strong>la</strong>raron en el censo que su<br />
fuente principal <strong>de</strong> agua era <strong>de</strong> Acueducto público<br />
<strong>de</strong>l IDAAN, Acueducto público <strong>de</strong> <strong>la</strong> comunidad o<br />
acueducto particu<strong>la</strong>r entre el número total <strong>de</strong><br />
personas.
PORCENTAJE DE LA POBLACIÓN CON ACCESO A AGUA POTABLE<br />
EN LA PROVINCIA DE VERAGUAS, SEGÚN DISTRITO<br />
Y CORREGIMIENTO: AÑO 2000<br />
Distritos y corregimientos<br />
TOTAL<br />
Pob<strong>la</strong>ción<br />
con agua<br />
(%)<br />
Pob<strong>la</strong>ción<br />
Total<br />
Pob<strong>la</strong>ción<br />
Menor <strong>de</strong> 18<br />
años<br />
Estimado <strong>de</strong> Niños(as)<br />
sin agua<br />
Número %<br />
82.4 209,076 84,539 16,520 19.54<br />
Río <strong>de</strong> Jesús Los Castillos 99.8 582 193 - -<br />
Montijo Pilón 99.4 541 186 1 0.55<br />
Río <strong>de</strong> Jesús Utira 99.1 318 98 1 0.94<br />
Santiago Canto <strong>de</strong>l L<strong>la</strong>no 99.0 23,654 8,975 87 0.96<br />
Santa Fé El Pantano 98.5 676 214 3 1.48<br />
Calobre Monjarás 98.2 569 201 4 1.76<br />
Calobre El Potrero 98.2 650 253 5 1.85<br />
Santiago San Pedro <strong>de</strong>l Espino 97.9 1,463 489 10 2.12<br />
Santiago La Raya <strong>de</strong> Santa María 97.6 3,517 1,240 30 2.42<br />
Soná Soná 96.7 10,104 4,040 135 3.35<br />
Montijo Montijo 96.5 4,545 1,726 61 3.54<br />
Santiago La Colorada 96.2 2,100 647 25 3.81<br />
Santiago Santiago 96.0 32,480 11,453 455 3.97<br />
Calobre La Raya <strong>de</strong> Calobre 95.2 495 183 9 4.85<br />
Cuadro e<strong>la</strong>borado por el Grupo SINAMP, <strong>de</strong> <strong>la</strong> Contraloría <strong>General</strong> <strong>de</strong> <strong>la</strong> República<br />
Fuente: CGR–DEC, Censos Nacionales <strong>de</strong> Pob<strong>la</strong>ción y Vivienda: Año 2000
PORCENTAJE DE LA POBLACIÓN CON ACCESO A AGUA POTABLE<br />
EN LA PROVINCIA DE VERAGUAS, SEGÚN DISTRITO<br />
Y CORREGIMIENTO: AÑO 2000 (Continuación)<br />
Distritos y corregimientos<br />
Pob<strong>la</strong>ción<br />
con agua<br />
(%)<br />
Pob<strong>la</strong>ción<br />
Total<br />
Pob<strong>la</strong>ción<br />
Menor <strong>de</strong> 18<br />
años<br />
Estimado <strong>de</strong> Niños(as)<br />
sin agua<br />
Número %<br />
Ata<strong>la</strong>ya El Barrito 95.0 856 304 15 5.02<br />
Santiago Los Algarrobos 94.5 4,623 1,711 94 5.52<br />
Ata<strong>la</strong>ya La Montañue<strong>la</strong> 94.0 736 250 15 5.98<br />
Santiago La Peña 93.2 3,746 1,403 96 6.81<br />
Ata<strong>la</strong>ya Ata<strong>la</strong>ya 93.1 4,449 1,696 116 6.86<br />
San Francisco San Francisco 93.0 2,221 842 59 7.02<br />
Calobre La Yeguada 92.9 1,444 708 50 7.06<br />
Calobre Calobre 92.5 2,619 1,059 80 7.52<br />
San Francisco Corral Falso 92.3 401 133 10 7.73<br />
Calobre Chitra 91.0 1,604 708 64 8.98<br />
Calobre Las Guías 90.8 1,745 653 60 9.17<br />
Soná Guarumal 90.0 3,340 1,380 138 10.00<br />
Calobre El Coc<strong>la</strong> 89.8 597 227 23 10.22<br />
Santa Fé El Alto 89.6 2,060 899 94 10.44<br />
Montijo Arenas 89.1 1,163 371 41 10.92<br />
Santa Fé Santa Fé 89.0 2,809 1,122 123 10.96<br />
Ata<strong>la</strong>ya La Carrillo 88.5 750 247 28 11.47<br />
Cuadro e<strong>la</strong>borado por el Grupo SINAMP, <strong>de</strong> <strong>la</strong> Contraloría <strong>General</strong> <strong>de</strong> <strong>la</strong> República<br />
Fuente: CGR–DEC, Censos Nacionales <strong>de</strong> Pob<strong>la</strong>ción y Vivienda: Año 2000
PORCENTAJE DE LA POBLACIÓN CON ACCESO A AGUA POTABLE<br />
EN LA PROVINCIA DE VERAGUAS, SEGÚN DISTRITO<br />
Y CORREGIMIENTO: AÑO 2000 (Continuación)<br />
Distritos y corregimientos<br />
Pob<strong>la</strong>ción<br />
con agua<br />
%<br />
Pob<strong>la</strong>ción<br />
Total<br />
Pob<strong>la</strong>ción<br />
Menor <strong>de</strong> 18<br />
años<br />
Estimado <strong>de</strong> Niños(as)<br />
sin agua<br />
Número %<br />
Las Palmas Corozal 88.0 1,034 456 55 11.99<br />
Cañazas Los Valles 87.6 1,245 630 78 12.45<br />
Ata<strong>la</strong>ya San Antonio 87.2 2,125 751 96 12.75<br />
Calobre San José 87.0 691 365 48 13.02<br />
Santa Fé Gatú o Gatucito 85.5 1,707 844 123 14.53<br />
Montijo L<strong>la</strong>no <strong>de</strong> Catival o Mariato 84.2 2,269 1,034 163 15.78<br />
La Mesa La Mesa 83.4 4,513 1,738 289 16.62<br />
Soná La Soledad 83.4 1,582 696 116 16.62<br />
Río <strong>de</strong> Jesús Río <strong>de</strong> Jesús 82.9 2,585 944 162 17.14<br />
Santa Fé El Cuay 82.5 1,588 729 128 17.51<br />
Las Palmas Lolá 81.2 1,022 448 84 18.79<br />
La Mesa Bisvalles 80.7 2,147 836 161 19.28<br />
Cañazas San Marcelo 80.6 2,998 1,234 239 19.38<br />
Montijo Leones 79.8 297 127 26 20.20<br />
Soná Río Gran<strong>de</strong> 78.0 3,317 1,537 338 21.98<br />
Calobre Barnizal 77.7 502 215 48 22.31<br />
Soná El Marañón 77.4 2,275 936 211 22.59<br />
Cuadro e<strong>la</strong>borado por el Grupo SINAMP, <strong>de</strong> <strong>la</strong> Contraloría <strong>General</strong> <strong>de</strong> <strong>la</strong> República<br />
Fuente: CGR–DEC, Censos Nacionales <strong>de</strong> Pob<strong>la</strong>ción y Vivienda: Año 2000
PORCENTAJE DE LA POBLACIÓN CON ACCESO A AGUA POTABLE<br />
EN LA PROVINCIA DE VERAGUAS, SEGÚN DISTRITO<br />
Y CORREGIMIENTO: AÑO 2000 (Continuación)<br />
Distritos y corregimientos<br />
Cuadro e<strong>la</strong>borado por el Grupo SINAMP, <strong>de</strong> <strong>la</strong> Contraloría <strong>General</strong> <strong>de</strong> <strong>la</strong> República<br />
Fuente: CGR–DEC, Censos Nacionales <strong>de</strong> Pob<strong>la</strong>ción y Vivienda: Año 2000<br />
Pob<strong>la</strong>ción<br />
con agua<br />
(%)<br />
Pob<strong>la</strong>ción<br />
Total<br />
Pob<strong>la</strong>ción<br />
Menor <strong>de</strong> 18<br />
años<br />
Estimado <strong>de</strong> Niños(as)<br />
sin agua<br />
Número %<br />
Santiago Ponuga 76.2 3,096 1,154 274 23.77<br />
Las Palmas Pixvae 76.1 883 461 110 23.90<br />
Río <strong>de</strong> Jesús Las Huacas 74.9 942 364 91 25.05<br />
La Mesa L<strong>la</strong>no Gran<strong>de</strong> 74.9 776 280 70 25.13<br />
Las Palmas Las Palmas 74.1 3,259 1,439 373 25.93<br />
Montijo Quebro 73.7 1,060 447 118 26.32<br />
Cañazas Cañazas 73.2 5,346 2,356 632 26.82<br />
Soná Quebrada <strong>de</strong> Oro 71.9 938 414 117 28.14<br />
San Francisco Los Hatillos 70.9 1,442 572 167 29.13<br />
La Mesa San Bartolo 69.6 2,351 1,081 329 30.41<br />
Las Palmas San Martín <strong>de</strong> Porres 67.5 761 377 122 32.46<br />
Montijo Tebario 65.3 959 431 150 34.72<br />
Soná Ro<strong>de</strong>o Viejo 65.1 2,212 878 306 34.90<br />
Calobre La Laguna 64.7 881 307 108 35.30<br />
Río <strong>de</strong> Jesús Catorce <strong>de</strong> Noviembre 63.7 829 279 101 36.31<br />
San Francisco San Juan 63.2 4,028 1,879 692 36.82<br />
La Mesa Boró 62.9 1,959 824 306 37.11
PORCENTAJE DE LA POBLACIÓN CON ACCESO A AGUA POTABLE<br />
EN LA PROVINCIA DE VERAGUAS, SEGÚN DISTRITO<br />
Y CORREGIMIENTO: AÑO 2000 (Conclusión)<br />
Distritos y corregimientos<br />
Pob<strong>la</strong>ción<br />
con agua<br />
(%)<br />
Pob<strong>la</strong>ción<br />
Total<br />
Pob<strong>la</strong>ción<br />
Menor <strong>de</strong> 18<br />
años<br />
Estimado <strong>de</strong> Niños(as)<br />
sin agua<br />
Número %<br />
Las Palmas Viguí 61.5 929 457 176 38.54<br />
Las Palmas El María 61.4 1,406 598 231 38.62<br />
Cañazas Cerro P<strong>la</strong>ta 59.3 1,595 778 317 40.69<br />
Calobre La Tetil<strong>la</strong> 56.8 387 135 58 43.15<br />
Soná Cativé 55.2 890 424 190 44.83<br />
Las Palmas El Prado 53.2 1,103 535 250 46.78<br />
San Francisco Remance 52.9 1,807 794 374 47.15<br />
Montijo Gobernadora 49.8 1,114 385 193 50.18<br />
Cañazas San José 49.5 1,726 868 439 50.52<br />
Santa Fé Río Luis 48.5 1,708 971 500 51.46<br />
Las Palmas Puerto Vidal 47.7 1,665 761 398 52.31<br />
Las Palmas Zapotillo 43.6 1,196 541 305 56.44<br />
Santa Fé Calovébora 36.6 2,342 1,400 888 63.41<br />
Las Palmas El Rincón 35.8 2,441 1,150 738 64.20<br />
Soná Calidonia 34.3 1,427 625 411 65.73<br />
Cañazas El Picador 32.9 3,089 1,518 1,019 67.11<br />
Montijo La Garceana 24.3 263 71 54 75.67<br />
Soná Bahía Honda 15.0 1,287 680 578 85.00<br />
Las Palmas Cerro <strong>de</strong> Casa 11.4 2,225 1,174 1,041 88.63<br />
Cuadro e<strong>la</strong>borado por el Grupo SINAMP, <strong>de</strong> <strong>la</strong> Contraloría <strong>General</strong> <strong>de</strong> <strong>la</strong> República<br />
Fuente: CGR–DEC, Censos Nacionales <strong>de</strong> Pob<strong>la</strong>ción y Vivienda: Año 2000
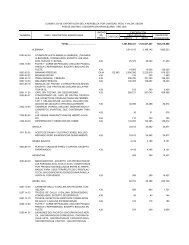
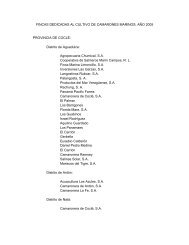
PORCENTAJE DE PARTOS ATENDIDOS POR PERSONAL ESPECIALIZADO<br />
EN LA PROVINCIA DE VERAGUAS, SEGÚN CORREGIMIENTO:<br />
AÑO 2005<br />
Menor<br />
25 %<br />
25.1 al<br />
50 %<br />
50.1 al<br />
75 %<br />
Cerro<br />
<strong>de</strong><br />
Casa<br />
El<br />
Rincón<br />
Mayor<br />
75 %<br />
San José<br />
El<br />
Picador<br />
Cerro<br />
P<strong>la</strong>ta<br />
Río Luis<br />
Calovébora<br />
Distrito y corregimiento<br />
Calobre La Laguna 72.7<br />
Santa Fé El Alto 65.7<br />
Las Palmas El Rincón 65.4<br />
Cañazas Los Valles 61.5<br />
Cañazas Cerro P<strong>la</strong>ta 61.4<br />
Santa Fé El Cuay 61.3<br />
Calobre Chitra 55.6<br />
Las Palmas Viguí 55.6<br />
Calobre San José 55.0<br />
Cañazas San José 41.0<br />
Cañazas El Picador 39.4<br />
Santa Fé Río Luis 39.0<br />
Las Palmas Cerro <strong>de</strong> Casa 38.3<br />
Santa Fé Gatú o Gatucito 36.8<br />
Santa Fé Calovébora 14.4<br />
%<br />
Mapa y Cuadro e<strong>la</strong>borado por el Grupo SINAMP, <strong>de</strong> <strong>la</strong> Contraloría <strong>General</strong> <strong>de</strong> <strong>la</strong> República<br />
Fuente: CGR–DEC, Sección <strong>de</strong> Estadísticas Vitales.<br />
Definición: Se refiere al porcentaje <strong>de</strong> los nacimientos ocurridos<br />
en insta<strong>la</strong>ciones <strong>de</strong> salud y los que recibieron asistencia en el<br />
hogar, por un profesional <strong>de</strong>l campo <strong>de</strong> <strong>la</strong> salud.
PORCENTAJE DE PARTOS ATENDIDOS POR PERSONAL ESPECIALIZADO<br />
EN LA PROVINCIA DE VERAGUAS, SEGÚN DISTRITO<br />
Y CORREGIMIENTO: AÑO 2005<br />
Distrito y corregimiento<br />
% Distrito y corregimiento<br />
%<br />
TOTAL<br />
87.4 Río <strong>de</strong> Jesús Los Castillos 100.0<br />
Ata<strong>la</strong>ya El Barrito 100.0 Río <strong>de</strong> Jesús Utira 100.0<br />
Ata<strong>la</strong>ya La Montañue<strong>la</strong> 100.0 Río <strong>de</strong> Jesús Catorce <strong>de</strong> Noviembre 100.0<br />
Ata<strong>la</strong>ya La Carrillo 100.0 San Francisco Corral Falso 100.0<br />
Ata<strong>la</strong>ya San Antonio 100.0 Santa Fé El Pantano 100.0<br />
Calobre Calobre 100.0 Santiago Santiago 100.0<br />
Calobre El Coc<strong>la</strong> 100.0 Santiago La Colorada 100.0<br />
Calobre La Raya <strong>de</strong> Calobre 100.0 Santiago La Raya <strong>de</strong> Santa María 100.0<br />
Calobre La Tetil<strong>la</strong> 100.0 Santiago San Pedro <strong>de</strong>l Espino 100.0<br />
Calobre Monjarás 100.0 Santiago Los Algarrobos 100.0<br />
La Mesa L<strong>la</strong>no Gran<strong>de</strong> 100.0 Soná Soná 100.0<br />
La Mesa Los Mi<strong>la</strong>gros 100.0 Soná Quebrada <strong>de</strong> Oro 100.0<br />
Las Palmas Corozal 100.0 Mariato Arenas 100.0<br />
Las Palmas Pixvae 100.0 Mariato El Cacao 100.0<br />
Las Palmas San Martín <strong>de</strong> Porres 100.0 Santiago Canto <strong>de</strong>l L<strong>la</strong>no 99.6<br />
Montijo La Garceana 100.0 Ata<strong>la</strong>ya Ata<strong>la</strong>ya 98.5<br />
Montijo Leones 100.0 Santiago La Peña 98.5<br />
Montijo Pilón 100.0 La Mesa La Mesa 98.4<br />
Río <strong>de</strong> Jesús Río <strong>de</strong> Jesús 100.0 Montijo Montijo 97.9<br />
Cuadro e<strong>la</strong>borado por el Grupo SINAMP, <strong>de</strong> <strong>la</strong> Contraloría <strong>General</strong> <strong>de</strong> <strong>la</strong> República<br />
Fuente: CGR–DEC, Sección <strong>de</strong> Estadísticas Vitales.
PORCENTAJE DE PARTOS ATENDIDOS POR PERSONAL ESPECIALIZADO<br />
EN LA PROVINCIA DE VERAGUAS, SEGÚN DISTRITO<br />
Y CORREGIMIENTO: AÑO 2005 (Conclusión)<br />
Distrito y corregimiento<br />
Cuadro e<strong>la</strong>borado por el Grupo SINAMP, <strong>de</strong> <strong>la</strong> Contraloría <strong>General</strong> <strong>de</strong> <strong>la</strong> República<br />
Fuente: CGR–DEC, Sección <strong>de</strong> Estadísticas Vitales.<br />
% Distrito y corregimiento %<br />
Soná La Soledad 97.6 Las Palmas El María 89.3<br />
Soná El Marañón 97.5 Las Palmas Lolá 88.9<br />
San Francisco San Francisco 97.4 Montijo Gobernadora 88.9<br />
La Mesa Boró 96.9 Mariato Tebario 88.9<br />
Soná Calidonia 96.9 Calobre El Potrero 85.7<br />
Soná Guarumal 96.2 Cañazas Cañazas 85.7<br />
Santiago Ponuga 95.9 Santa Fé Santa Fé 85.7<br />
Mariato Quebro 94.4 Soná Cativá 85.7<br />
Río <strong>de</strong> Jesús Las Huacas 94.1 Soná Ro<strong>de</strong>o Viejo 84.8<br />
Mariato L<strong>la</strong>no <strong>de</strong> Catival o Mariato 93.2 San Francisco Los Hatillos 84.2<br />
Cañazas El Aromillo 92.6 Las Palmas Puerto Vidal 84.0<br />
Cañazas San Marcelo 92.3 San Francisco Remance 84.0<br />
Calobre Las Guías 91.7 Calobre Barnizal 81.8<br />
San Francisco San Juan 91.4 La Mesa Bisvalles 81.3<br />
La Mesa San Bartolo 91.2 Las Palmas Las Palmas 80.8<br />
Soná Bahía Honda 90.7 Calobre La Yeguada 78.6<br />
Las Palmas El Prado 90.3 Las Palmas Zapotillo 76.0<br />
Soná Río Gran<strong>de</strong> 89.4
PORCENTAJE DE PARTOS ATENDIDOS POR PERSONAL ESPECIALIZADO<br />
EN LA PROVINCIA DE VERAGUAS: PERÍODO 1996-2005<br />
100.0<br />
P<br />
o<br />
r<br />
c<br />
e<br />
n<br />
a<br />
j<br />
e<br />
90.0<br />
80.0<br />
70.0<br />
60.0<br />
50.0<br />
40.0<br />
30.0<br />
74.3<br />
76.3<br />
74.0<br />
76.3<br />
75.9<br />
83.3<br />
88.8<br />
85.9<br />
87.2<br />
87.4<br />
20.0<br />
10.0<br />
0.0<br />
<strong>Veraguas</strong><br />
Ten<strong>de</strong>ncia Nacional<br />
1996 1997 1998 1999 2000 2001 2002 2003 2004 2005<br />
Gráfica e<strong>la</strong>borada por el Grupo SINAMP, <strong>de</strong> <strong>la</strong> Contraloría <strong>General</strong> <strong>de</strong> <strong>la</strong> República<br />
Fuente: CGR–DEC, Sección <strong>de</strong> Estadísticas Vitales.<br />
Año<br />
Definición: Se refiere al porcentaje <strong>de</strong> los nacimientos ocurridos<br />
en insta<strong>la</strong>ciones <strong>de</strong> salud y los que recibieron asistencia en el<br />
hogar, por un profesional <strong>de</strong>l campo <strong>de</strong> <strong>la</strong> salud.
TASA DE MORTALIDAD INFANTIL ESTIMADA EN LA PROVINCIA<br />
DE VERAGUAS: AÑOS 2003-05<br />
18.9<br />
18.3<br />
17.9<br />
Por mil nacimientos vivos<br />
2003 2004 2005<br />
Gráfica e<strong>la</strong>borada por el Grupo SINAMP, <strong>de</strong> <strong>la</strong> Contraloría <strong>General</strong> <strong>de</strong> <strong>la</strong> República<br />
Fuente: CGR–DEC, Sección <strong>de</strong> Análisis Demográfico<br />
Definición: Se refiere exclusivamente a <strong>la</strong>s <strong>de</strong>funciones <strong>de</strong><br />
niños que todavía no han cumplido un año <strong>de</strong> vida por mil<br />
nacidos vivos en un año <strong>de</strong>terminado.